Introduction to Notebooks and Databases
This module provides an introduction to Jupyter Notebooks and Google Colaboratory, exploring their features and structure, including code cells and text cells. Additionally, we cover key public databases for single-cell data and other databases for gene expression, containing information for humans and other organisms. To enhance learning, we provide hands-on exercises for accessing, exploring, and analyzing these databases, allowing users to develop essential skills in biological data manipulation.
Are you familiar with Jupyter Notebooks?
Jupyter Notebooks are an interactive tool that combines executable code, explanatory text, visualizations, and other elements into a single document. Widely used in data science, machine learning, and computational analysis, they support multiple programming languages, with Python being the most popular. Their intuitive interface simplifies data exploration, experiments, and real-time documentation.
Here, we have text cells and code cells serve distinct purposes for organizing and presenting content within notebooks:
Text Cells
- These are used for adding explanations, descriptions, and formatting using Markdown or HTML.
- You can insert headings, lists, links, equations, and other elements to document your work and make it more comprehensible (for you and other people who want to use them).
- Click the + Markdown in the top toolbar.
- Enter your text in the cell using Markdown for formatting (e.g., # for headings, ** for bold text, * for italics).
- Click outside the cell or press Shift + Enter to render the formatted text.
Add a Text Cell:
Jupyter Cells
Code Cells- These are used to write and execute programming code, primarily in Python.
- They allow you to test algorithms, manipulate data, and create visualizations, with outputs displayed directly below the executed code.
- Click the + Code button at the top toolbar of the notebook to insert a code cell below the active one.
- Enter your code in the cell and press Shift + Enter to execute it.
Add a Code Cell:
#test python code here
test = 4
print("Hello World")
Here I can write beautiful texts
Notes:
1: If you want to see the webpages/videos inside this notebook, you need to add this extension:
Google extension or Firefox extension
2: If you want to create a Colab notebook with an R kernel, you can do it with this link:
Colab with R or Other form
Google colaboratory
Google Colab is a free cloud-based platform that allows you to create, run, and share Jupyter notebooks directly in your browser. It supports languages like Python and provides access to powerful computational resources such as GPUs and TPUs, making it ideal for machine learning and data science tasks.
Additionally, it integrates with Google Drive, enabling easy storage and real-time collaboration.
Exploring Single-Cell RNA-seq repositories
In this activity, we will explore online repositories and tools for single-cell RNA-seq data analysis. We will navigate through various databases, including the Single Cell Expression Atlas (https://www.ebi.ac.uk/gxa/sc/home), Human Cell Atlas Data Portal (https://data.humancellatlas.org/), CELLXGENE (https://cellxgene.cziscience.com/), SRA (https://www.ncbi.nlm.nih.gov/sra), GEO (https://www.ncbi.nlm.nih.gov/geo/), (https://panglaodb.se/), CellType (https://celltype.info/), and CellTypist (https://www.celltypist.org/), to discover and explore single-cell RNA-seq datasets. Through this hands-on exercise, you will learn how to access, visualize, and interpret single-cell RNA-seq data using online resources.
Objectives:
- Explore single-cell RNA-seq data repositories and tools
- Learn how to access and visualize single-cell RNA-seq data
- Understand how to interpret single-cell RNA-seq data
Note: This activity is designed to be completed in a self-paced manner, and you can work through the exercises at your own speed.
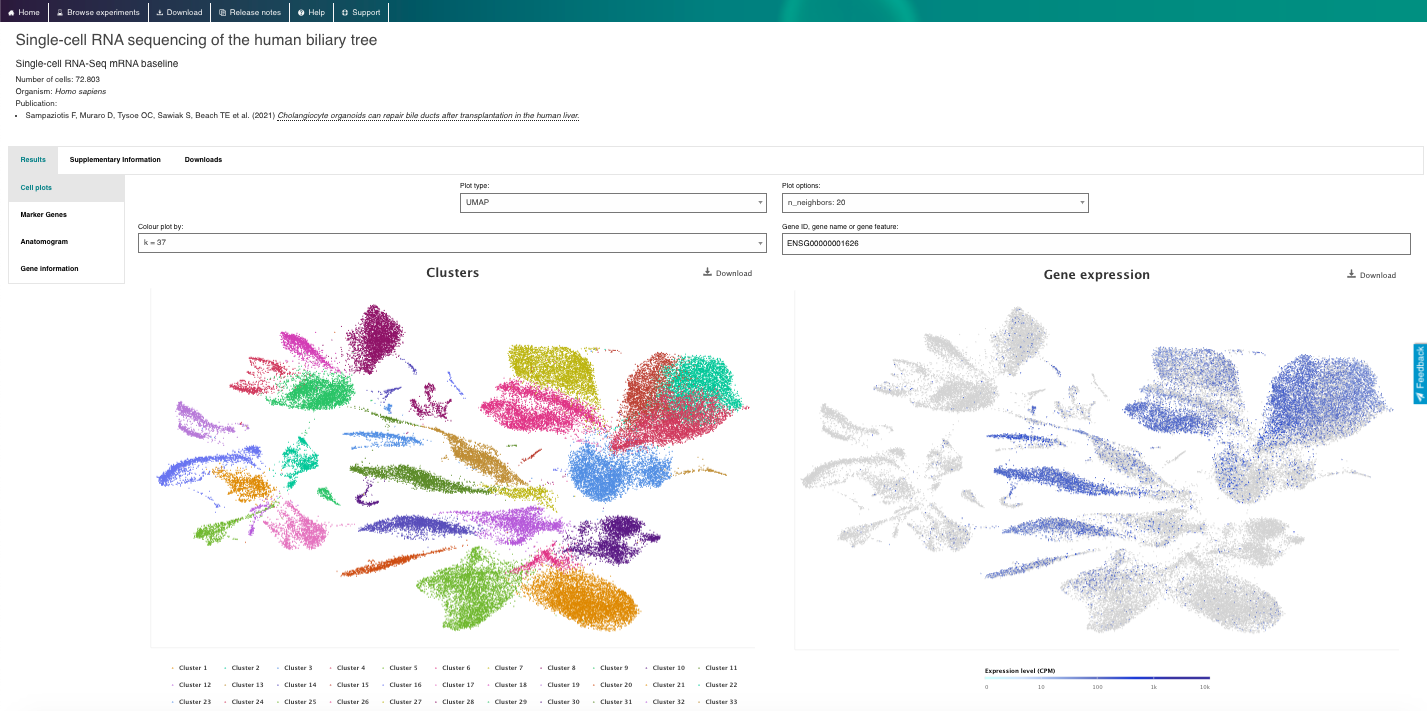
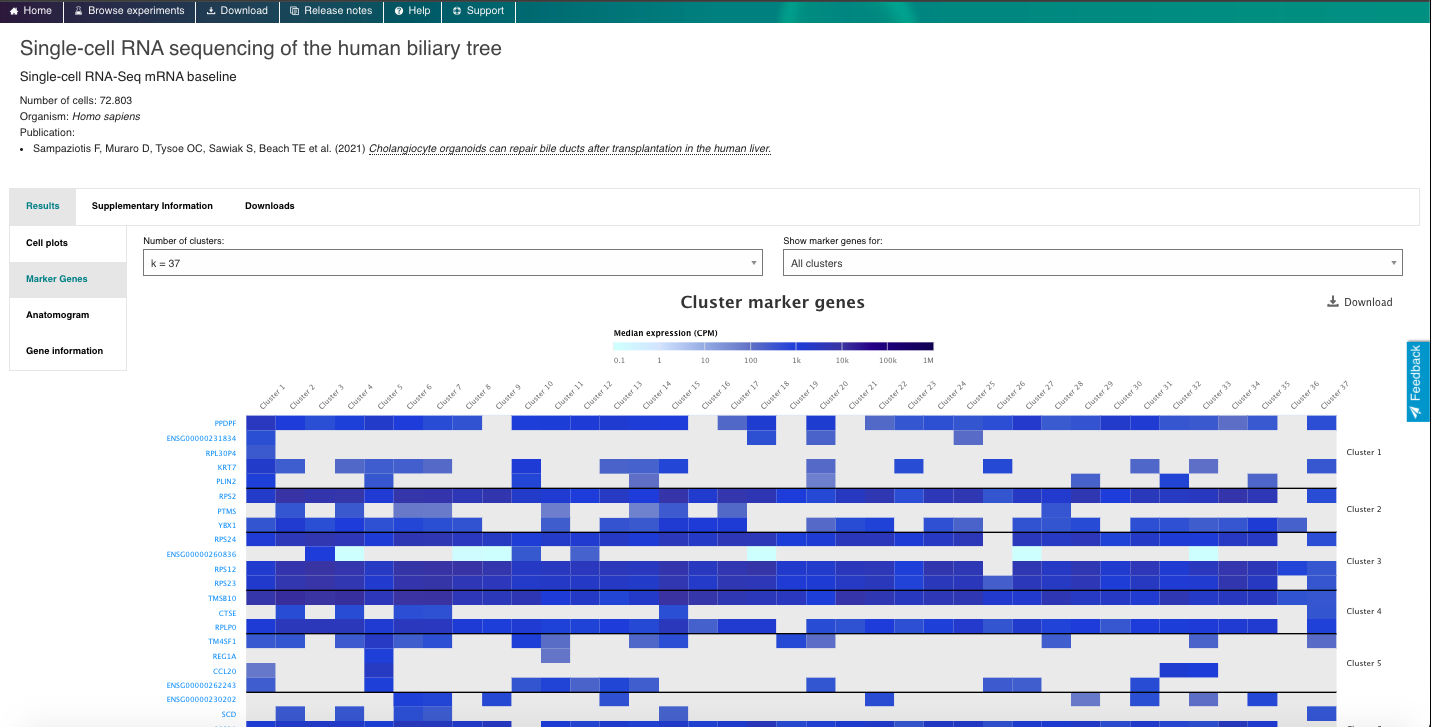
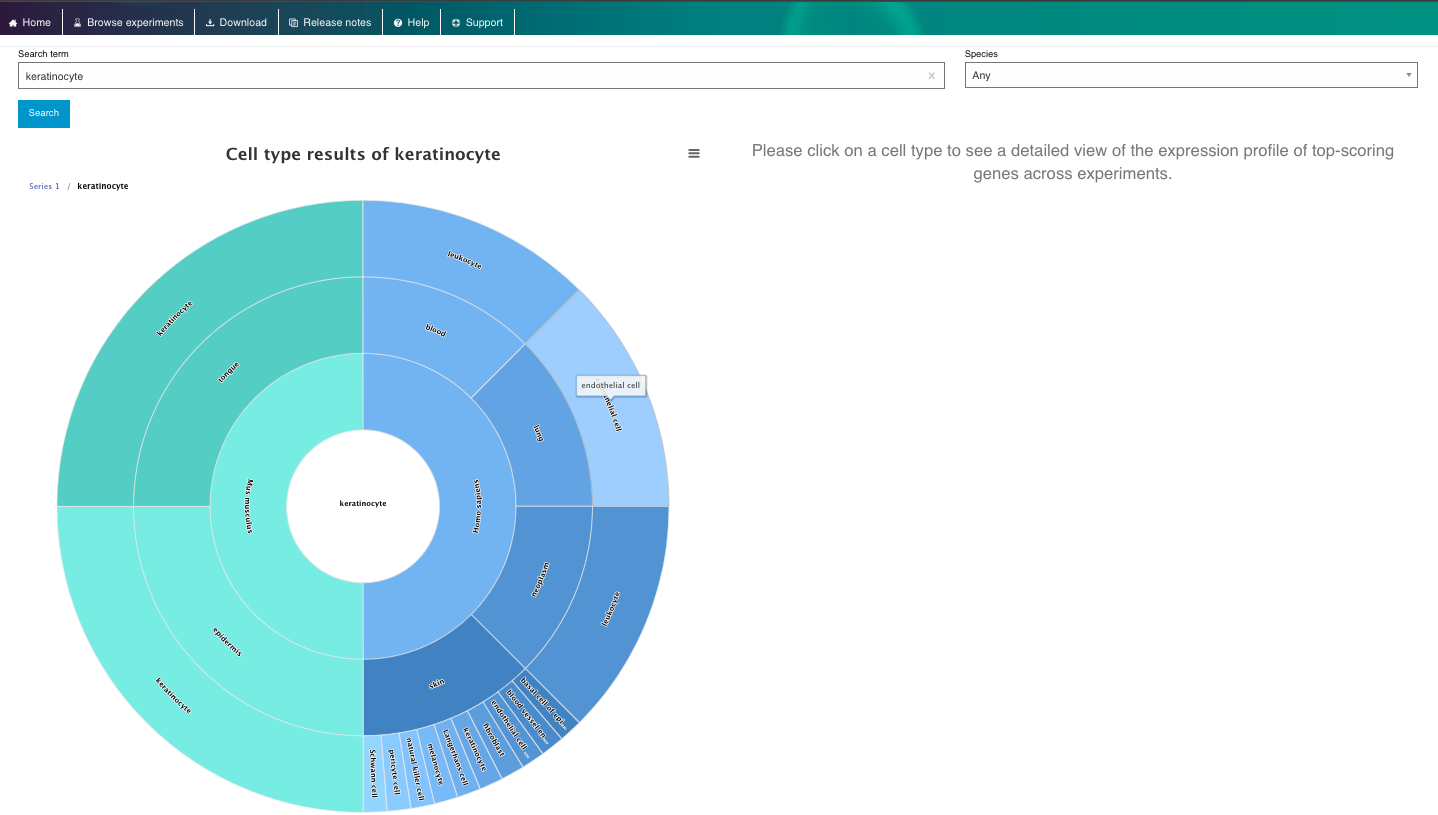
Single Cell Expression Atlas
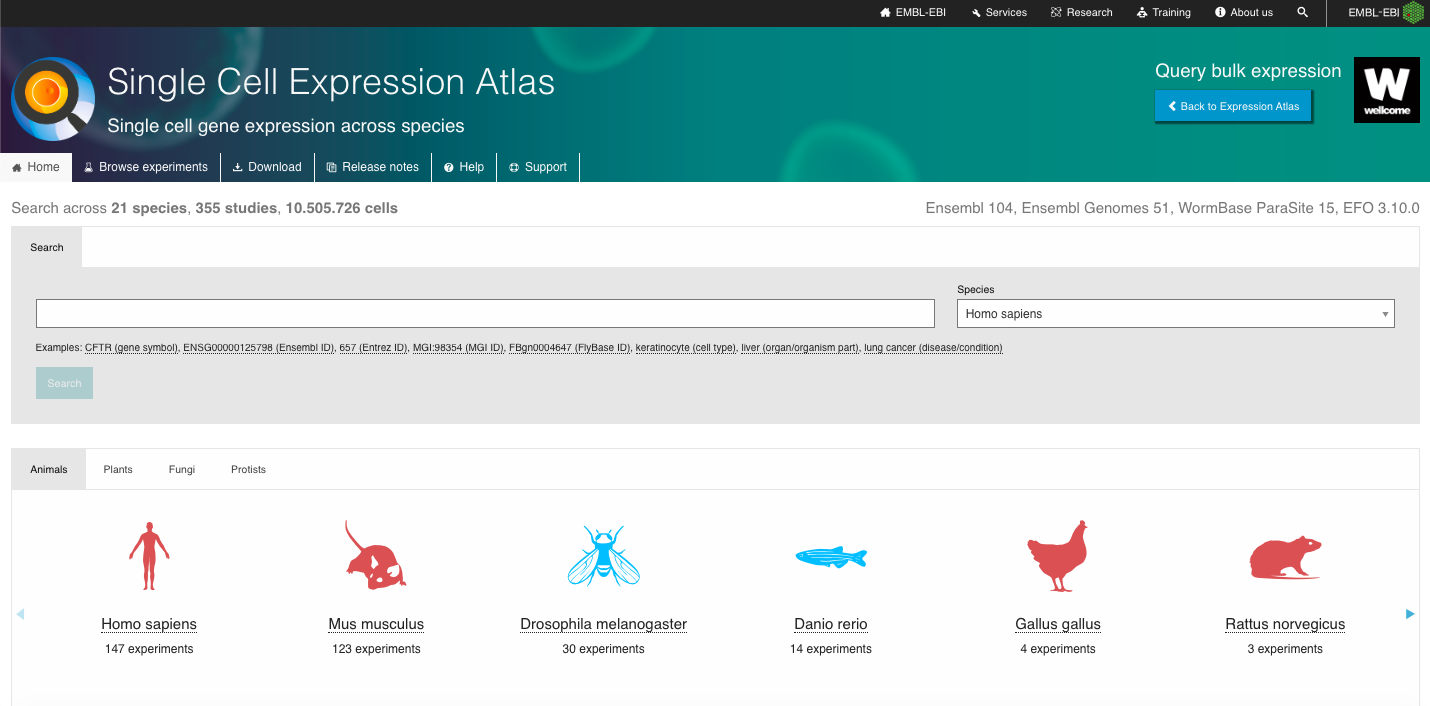
The Single Cell Expression Atlas is a web-based repository that provides access to a vast collection of single-cell RNA-seq datasets from various organisms and tissues. The atlas allows users to explore and compare gene expression profiles across different cell types, tissues, and conditions. Practical Exercises:
1. Explore the Single Cell Expression Atlas General Interface:
- Go to the Single Cell Expression Atlas website. You can access the website through your own browser or the browser embedded in the end of this session in this notebook: https://www.ebi.ac.uk/gxa/sc/home
- One of the advantages of this repository is the wide range of organisms with single-cell data available, covering Animals, Plants, Fungi and Protists species. Navigate through the webpage, exploring the different species available and explore the one of your interest to furher explore.
- Explore also the other set of experiments available, which includes data from the Human Cell Atlas, Fly Cell Atlas, Malaria Cell Atlas, COVID-19 Data Portal and discovAIR initiatives..
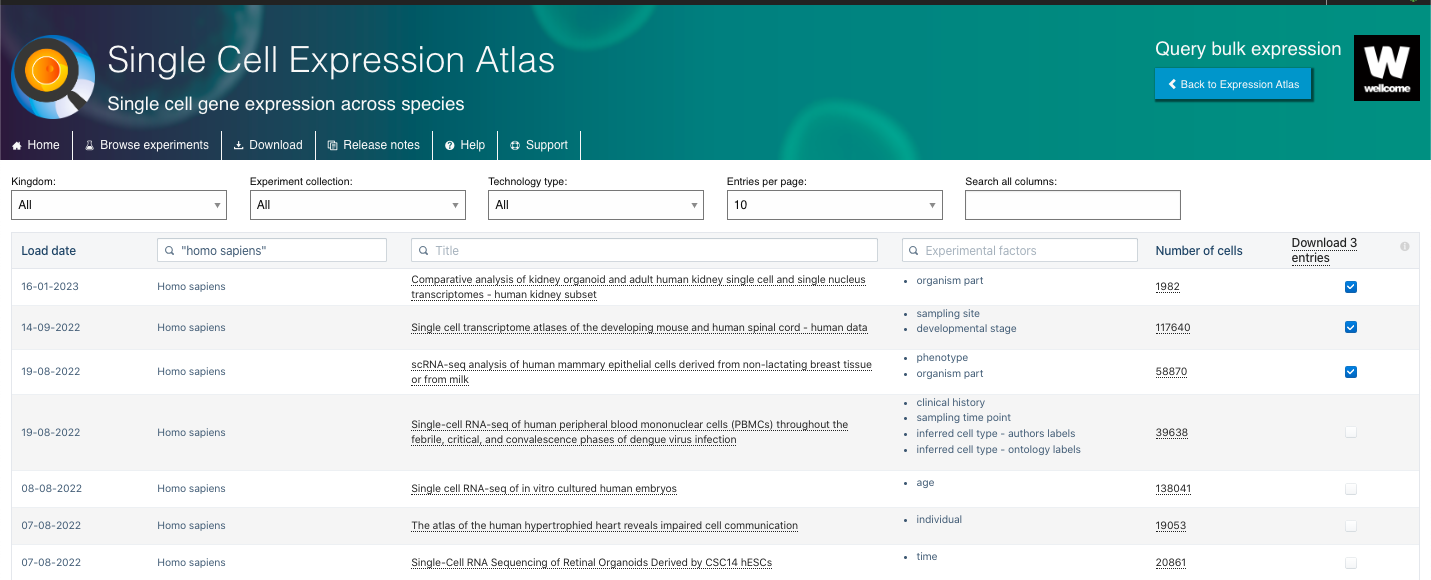
2. Search for a Dataset of Interest:
- By selecting an species or excperiment collection of interest, you will have access to a list of experiments linked to that organism/initiative.
- There you can select experiments based on different variables, including the organism Kingdom, Experiment Collection, Technology Type. You can also explore other features such as the Title of the study, Experimental Factors (e.g. organism parte, developmental state, age, etc), and the Number of Cells available.
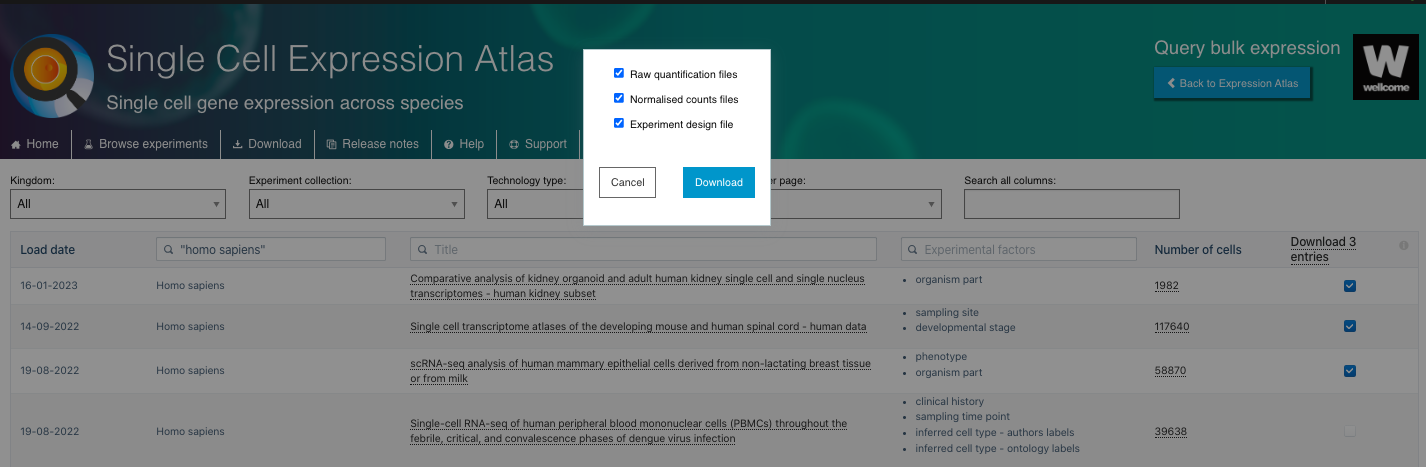
- There you can also select the set of experiments of interest to download the Raw quantification files, Normalised counts files and Experiment design file.
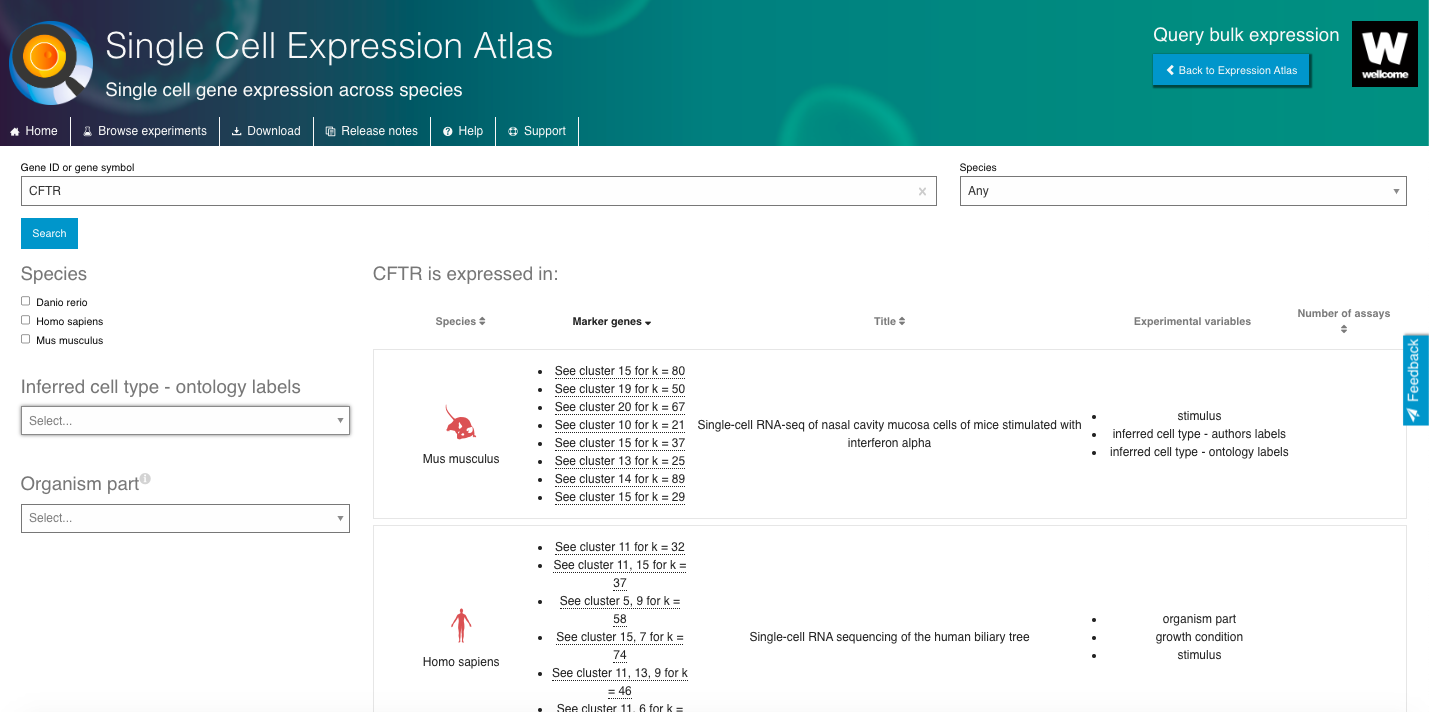
3. Visualize and Explore Available Data:
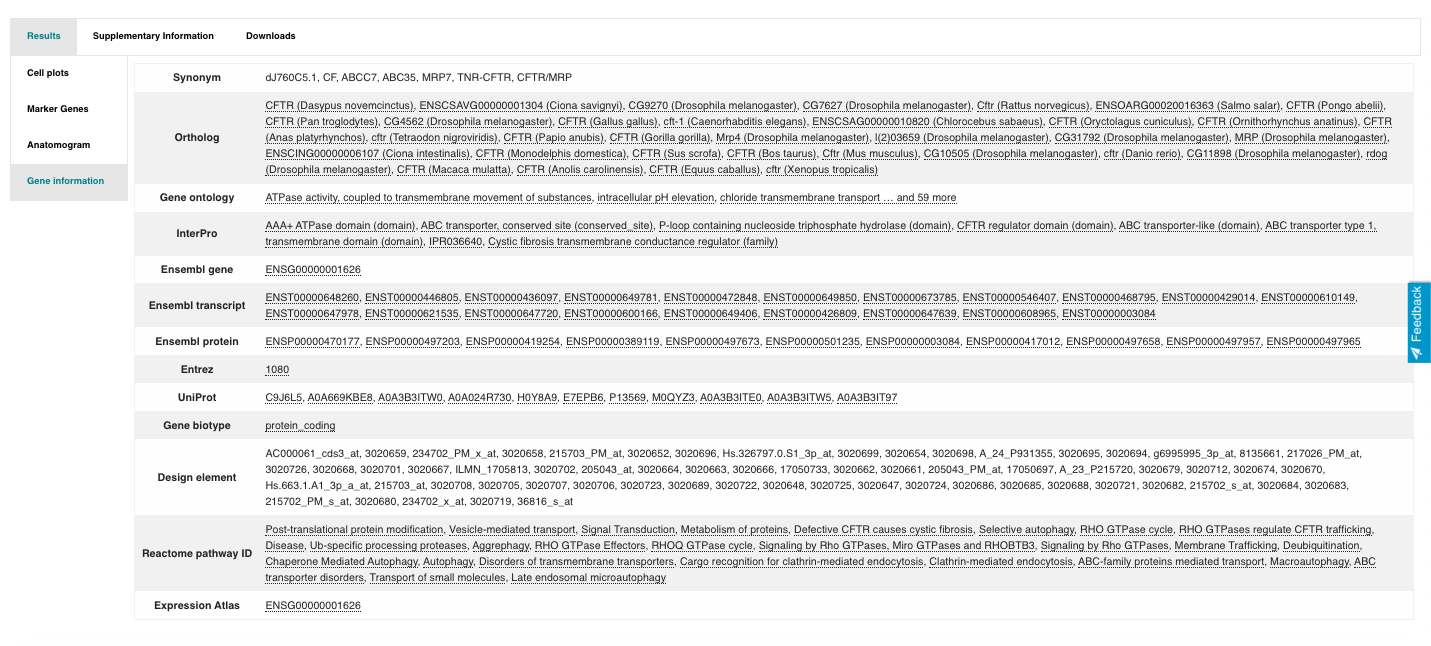
- Select a gene or cell type of interest and navigate through the interactive browser, exploring different aspects of the data available.
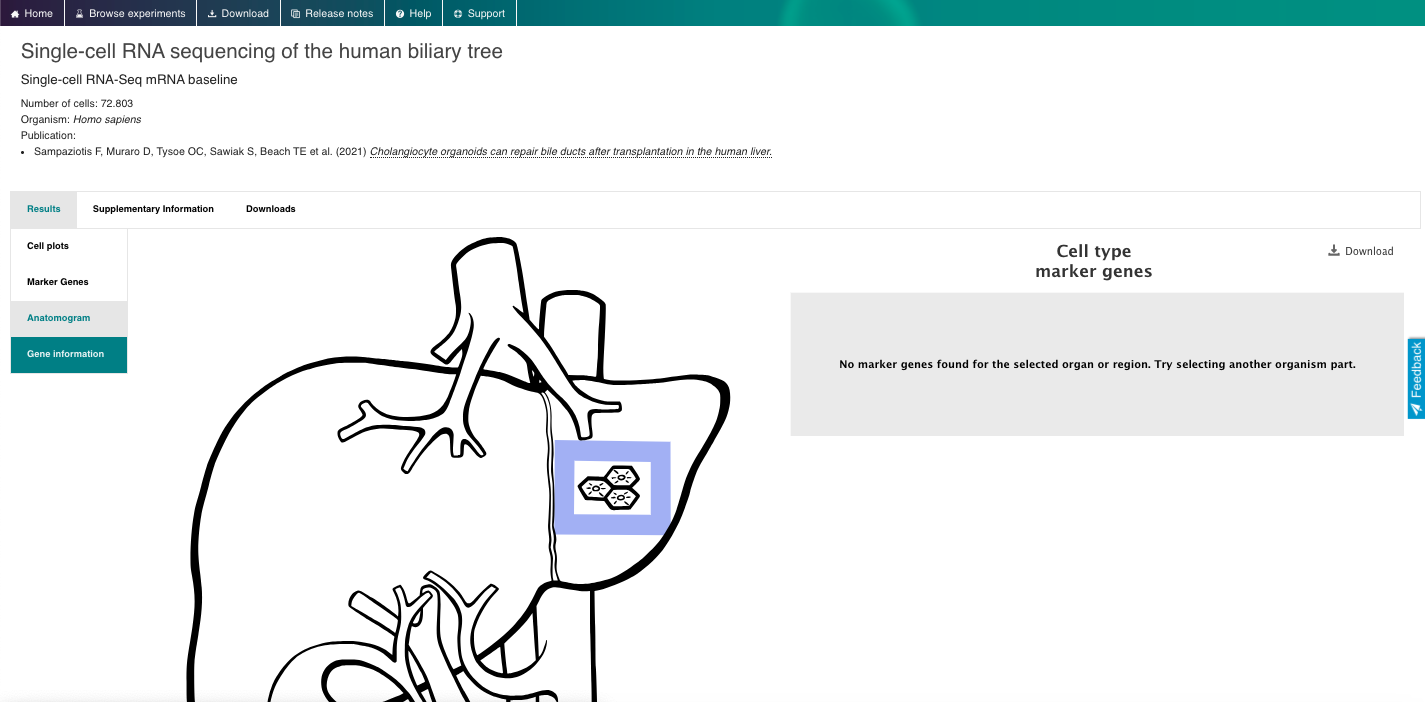
- Select datasets based on the "Inferred cell type - ontology labels" or "Organism part".
- Select a dataset of interest and dive into all the data available.
- Visualize the gene expression profiles using the interactive plots (e.g., t-SNE, heatmap).
- Visualize gene markers and enjoy other nice features from the repository.
4. Now enjoy the reposity, by playing with the data and genes of interest. You can use the embedded browser available below, or the main browser from your computer: https://www.ebi.ac.uk/gxa/sc/home
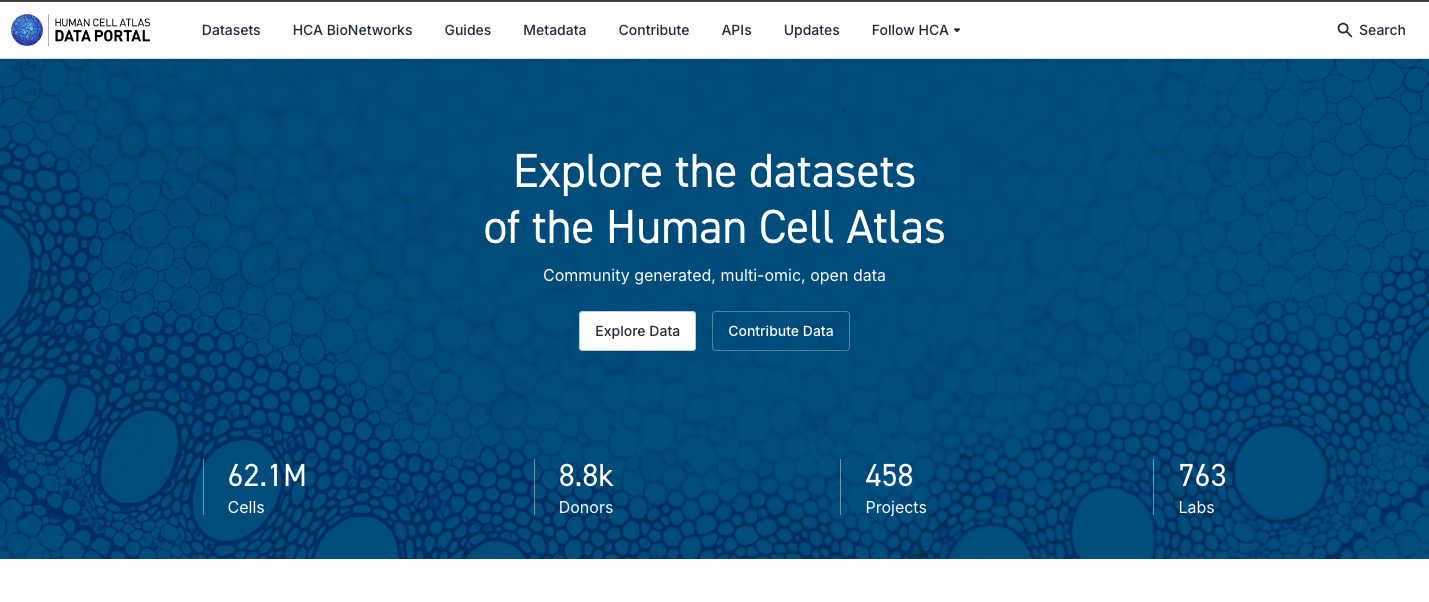
Human Cell Atlas, Data portal
Brief Description:The Human Cell Atlas Data Portal is a web-based repository that provides access to a vast collection of single-cell RNA-seq datasets from various human tissues and cell types. The portal is the main repository of the Human Cell Atlas initiative, and it allows users to explore, visualize, and analyze gene expression profiles across different cell types, tissues, and conditions generated by the consortium.
Pratical Exercises:
1. Explore the General Portal Interface:
- Go to the Human Cell Atlas Data Portal website: https://data.humancellatlas.org/
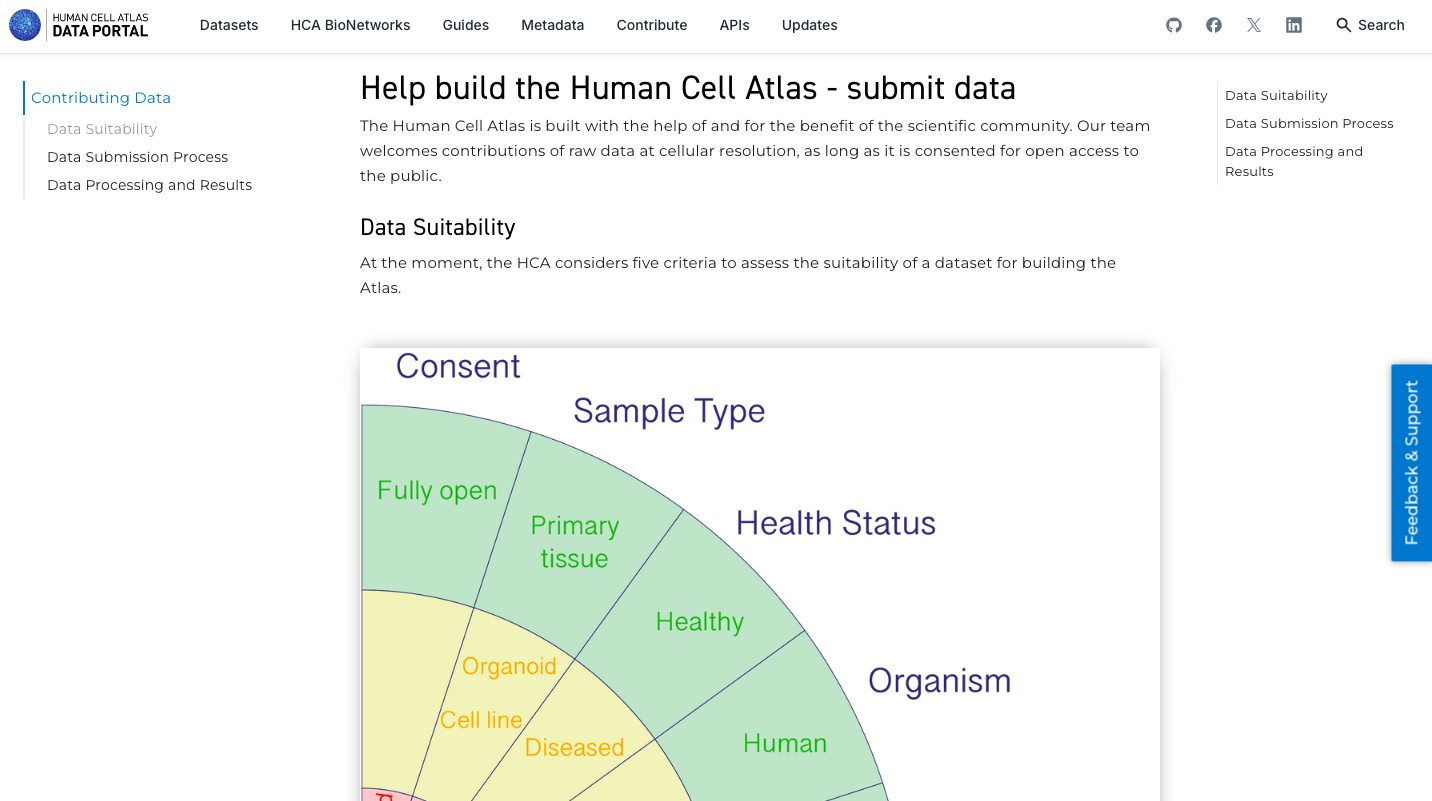
- Explore the website general functionalities, visualizing the data available and how to contribute with data.
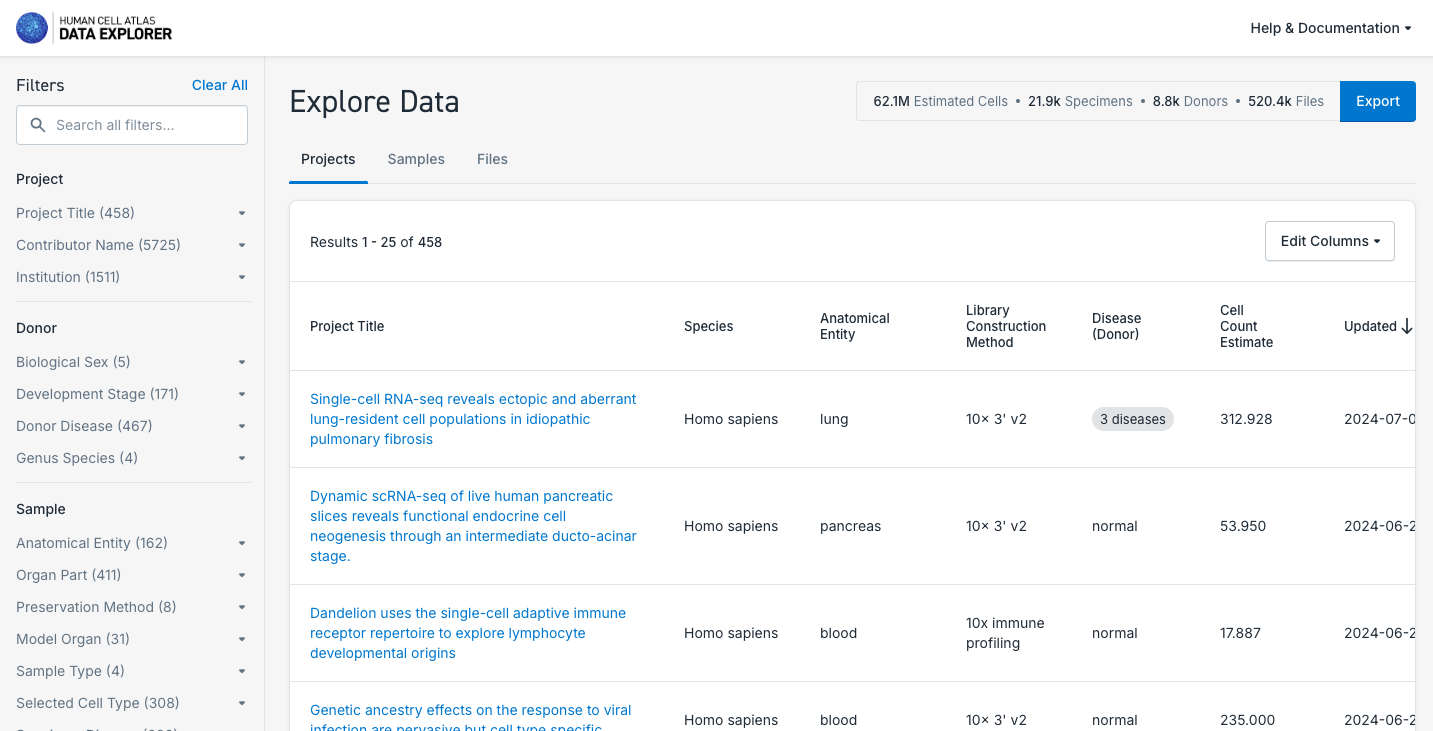
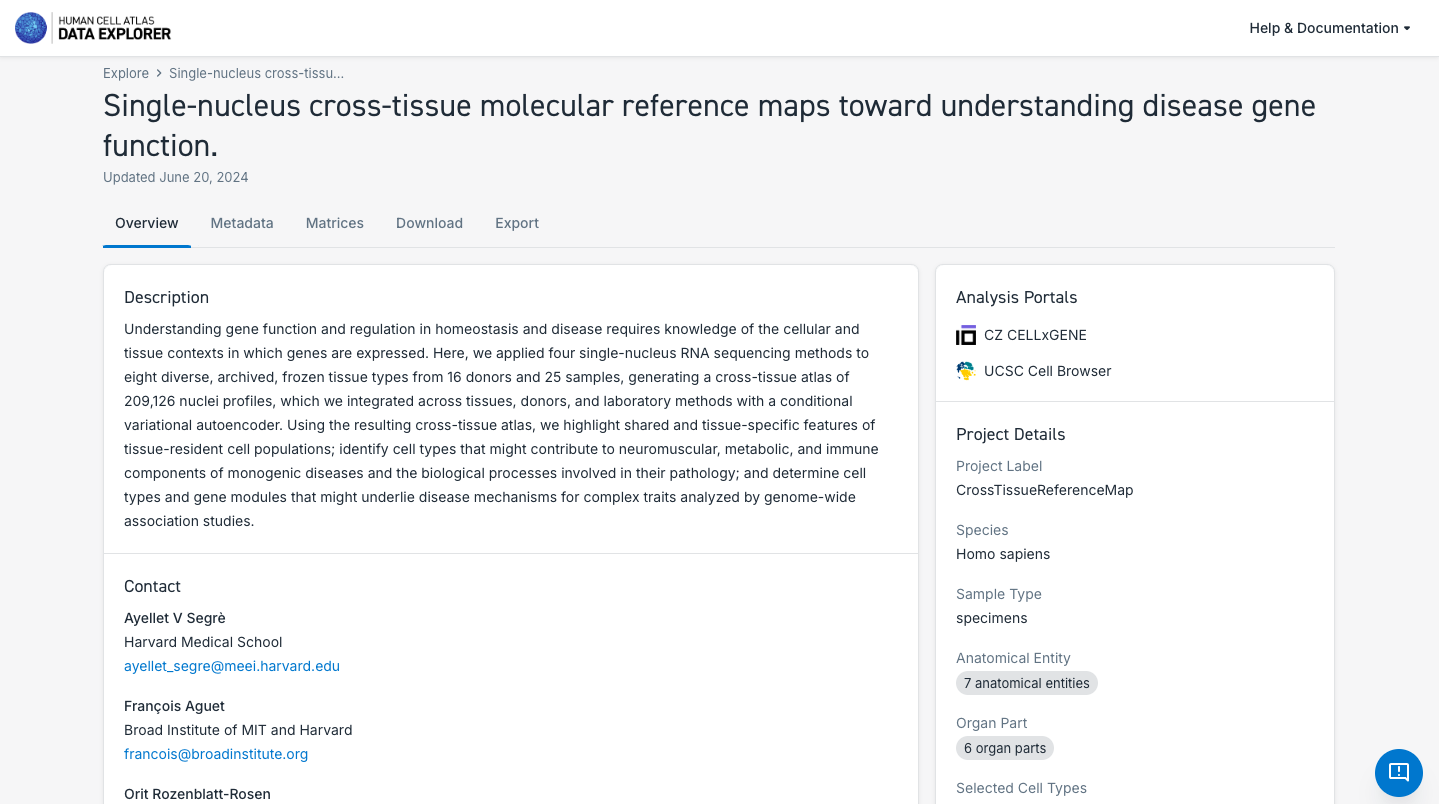
2. Search and Explore a Dataset of Interest:
- Explore the datasets available, navigating through the Projects, Samples and Files available. Use the filters available to perform a more specific selection.
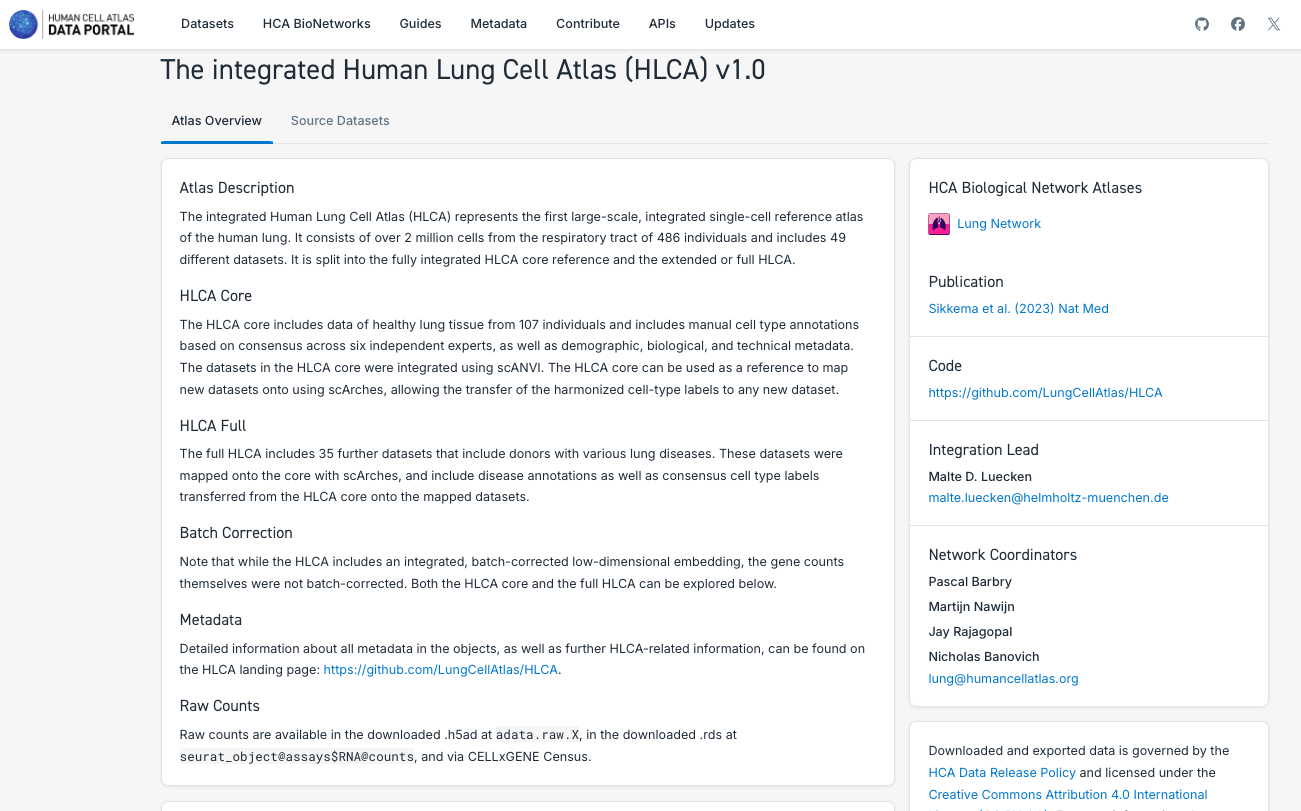
- After selecting a particular dataset, navigate though the dataset Overview, Metadata, Matrices, Download and Export tabs.
- Check if the dataset allow you to explore it deeper in another Analysis Portal (e.g. UCSC Genome Browser or CELLXGENE).
- Check the possibility to Export the data available to analyze it in Terra cloud solution. Note that this is a private third party platform.
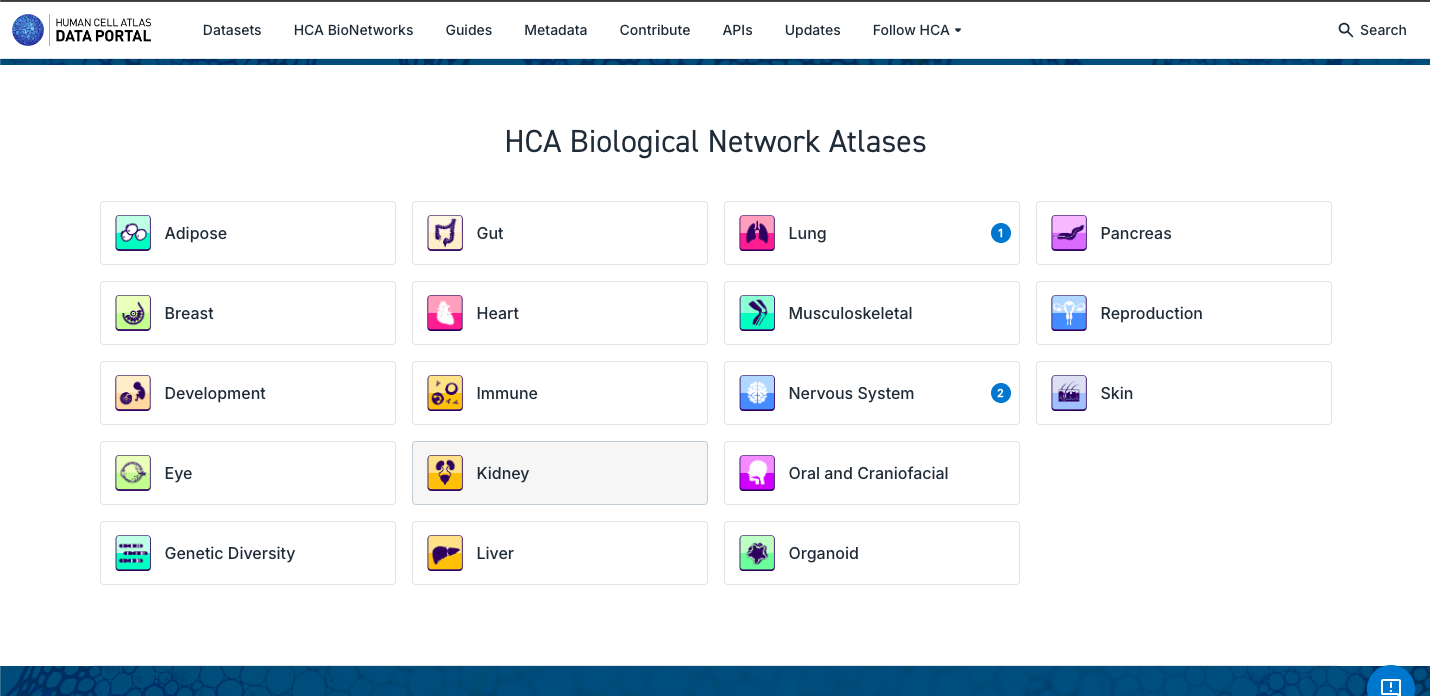
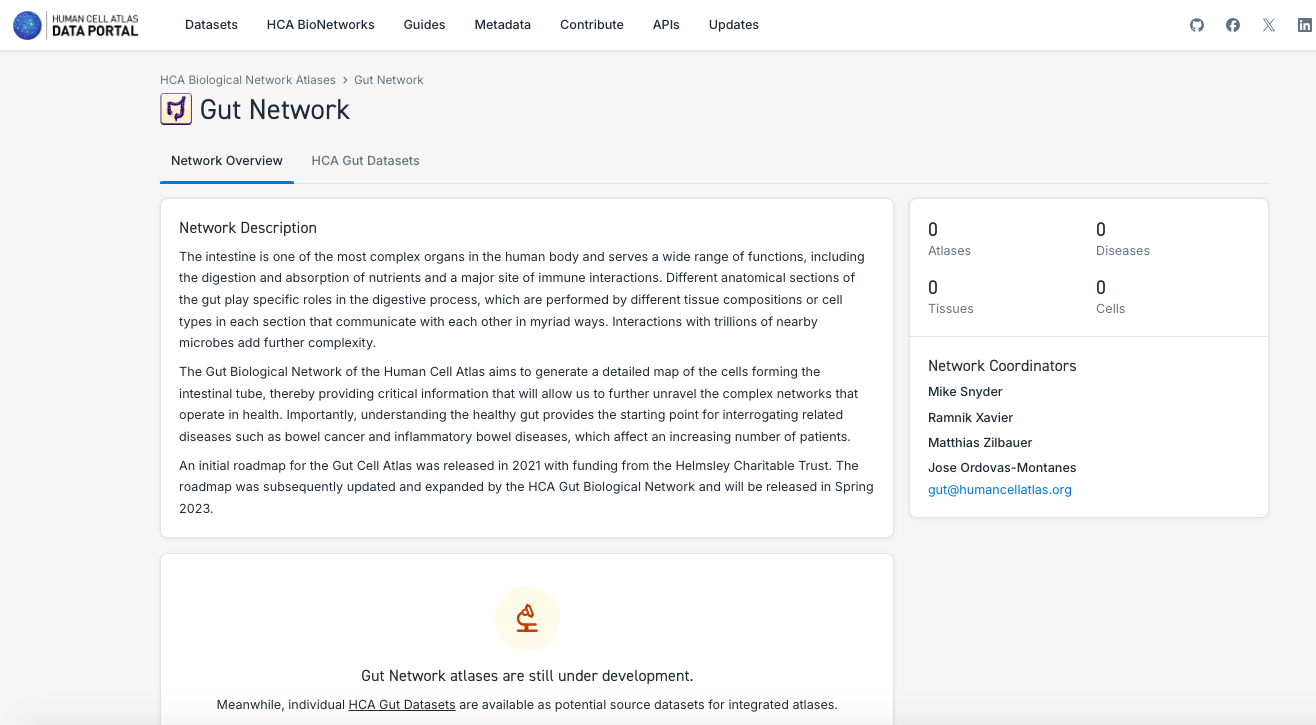
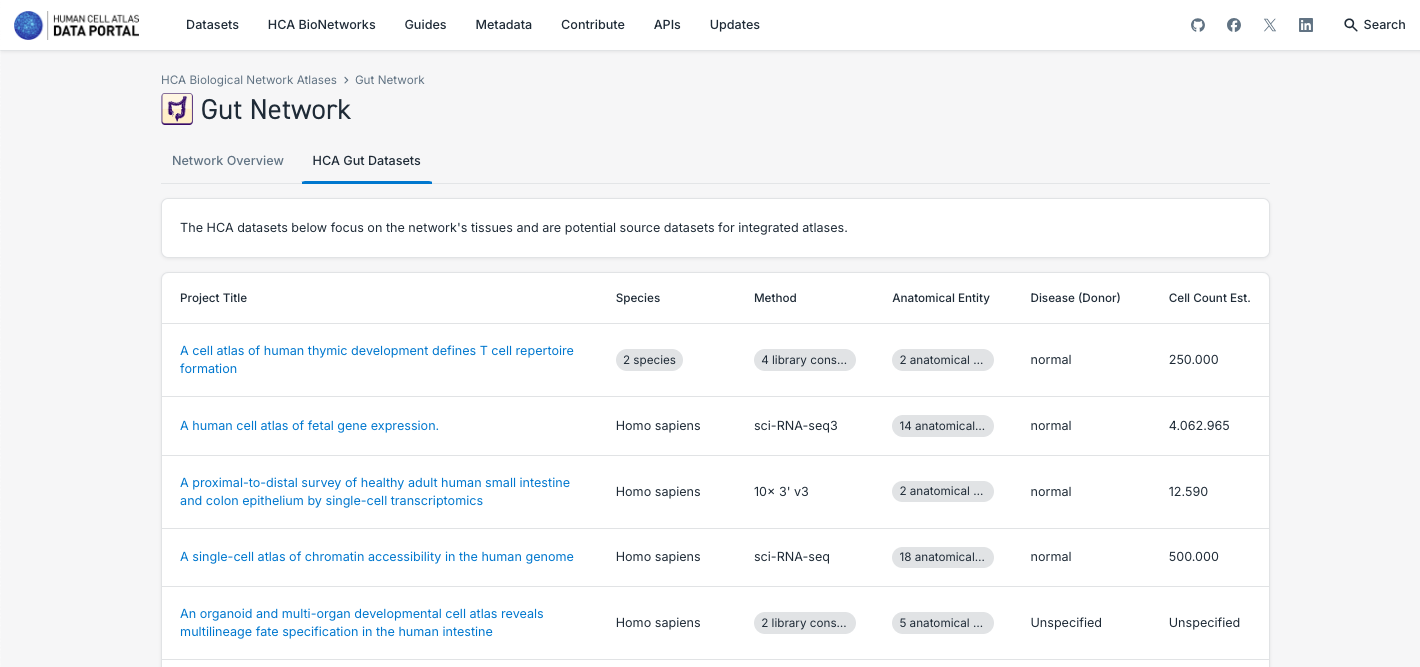
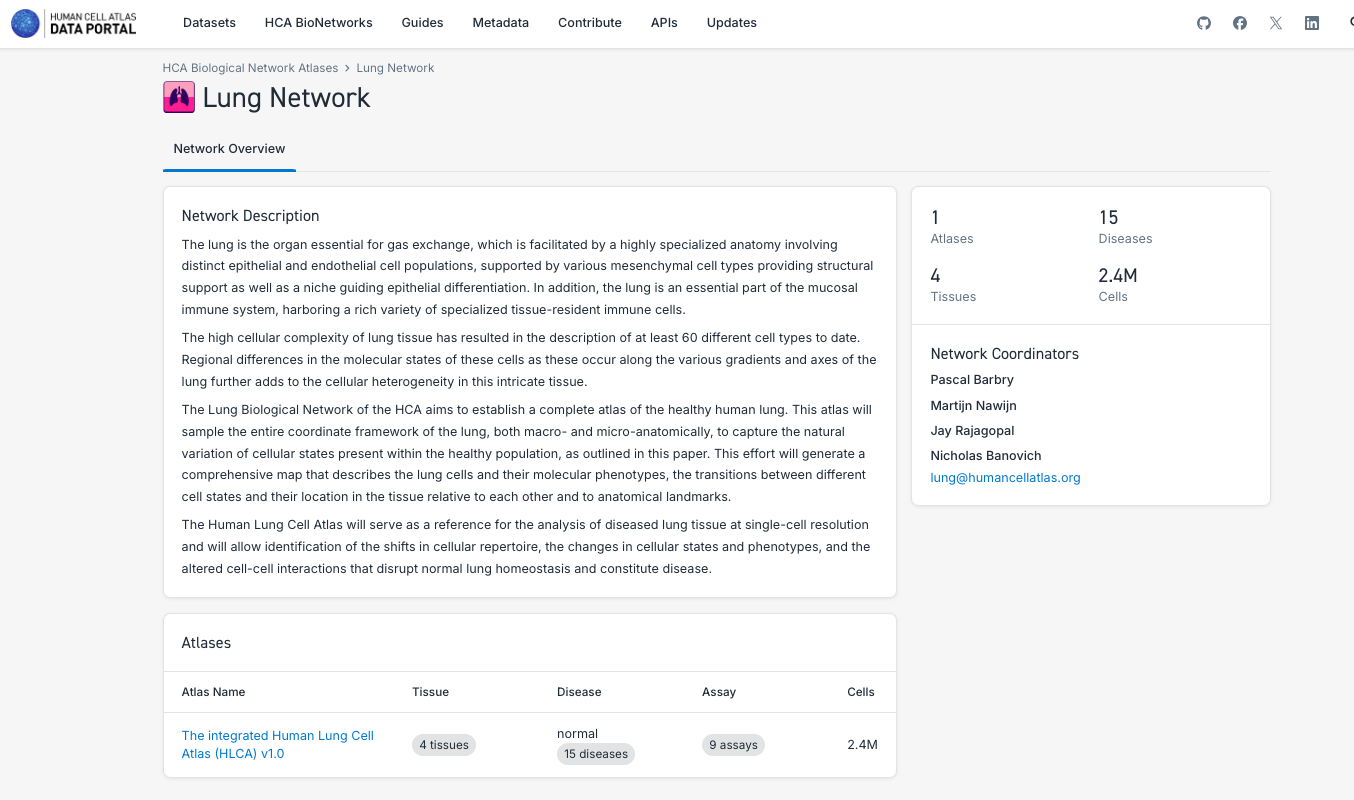
3. Search and Explore the Atlases Generated by a Human Cell Atlas Bionetwork:
- Note that each Bionetwork posses datasets, but at the moment only Lung and Nervous System have unified atlases available.
- Navigate through the different bionetworks, exploring the data and atlases available.
- Explore the different particularities of the components of the atlases, such as the number of tissues, disease state, number of cells and the possibility to explore it further in CELLxGENE or downloading the data.
4. Explore the guides available to know more about all functionalities and different aspects of the HCA Data Portal:
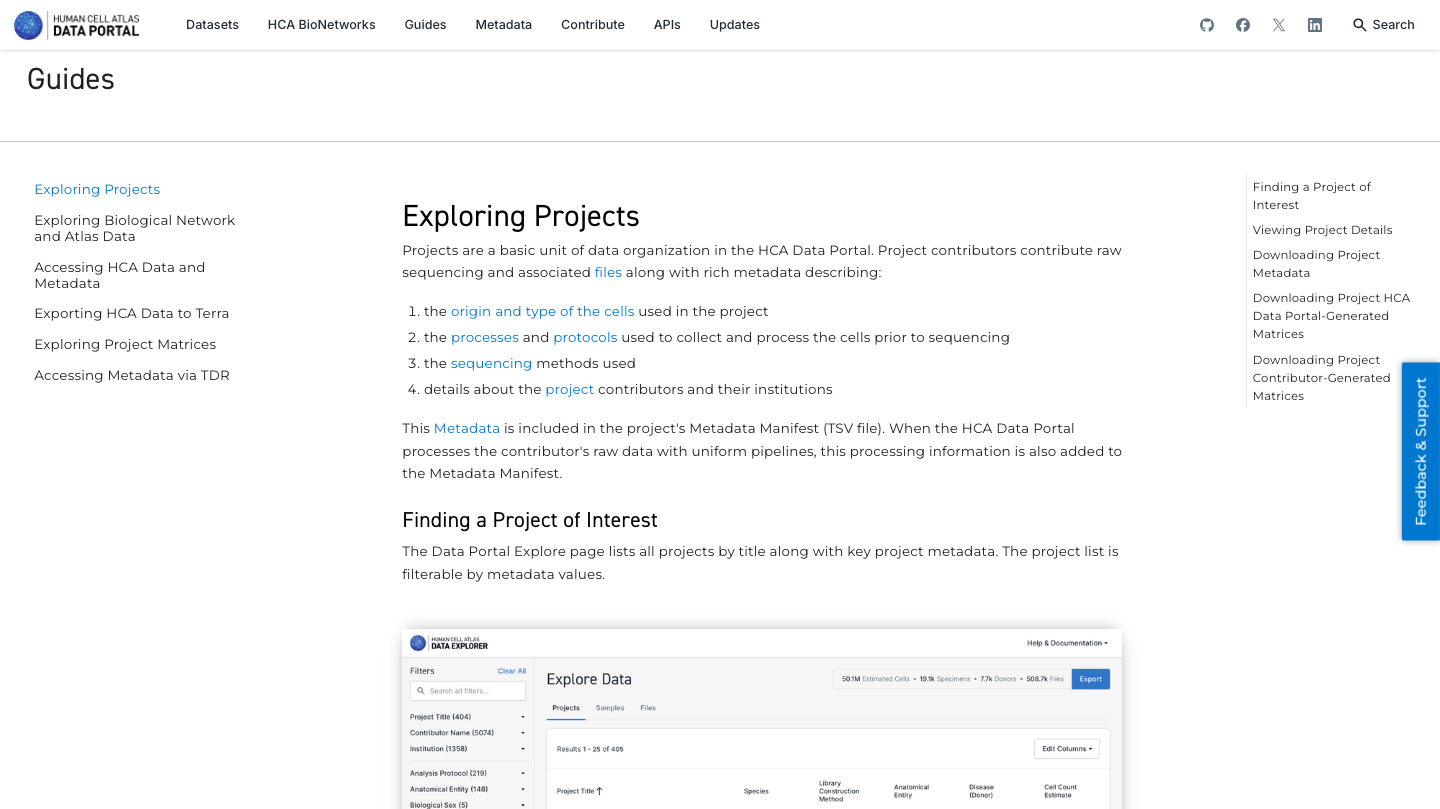
5. Now enjoy the reposity, by playing with the data and genes of interest. You can use the embedded browser available below, or the main browser from your computer: https://data.humancellatlas.org/
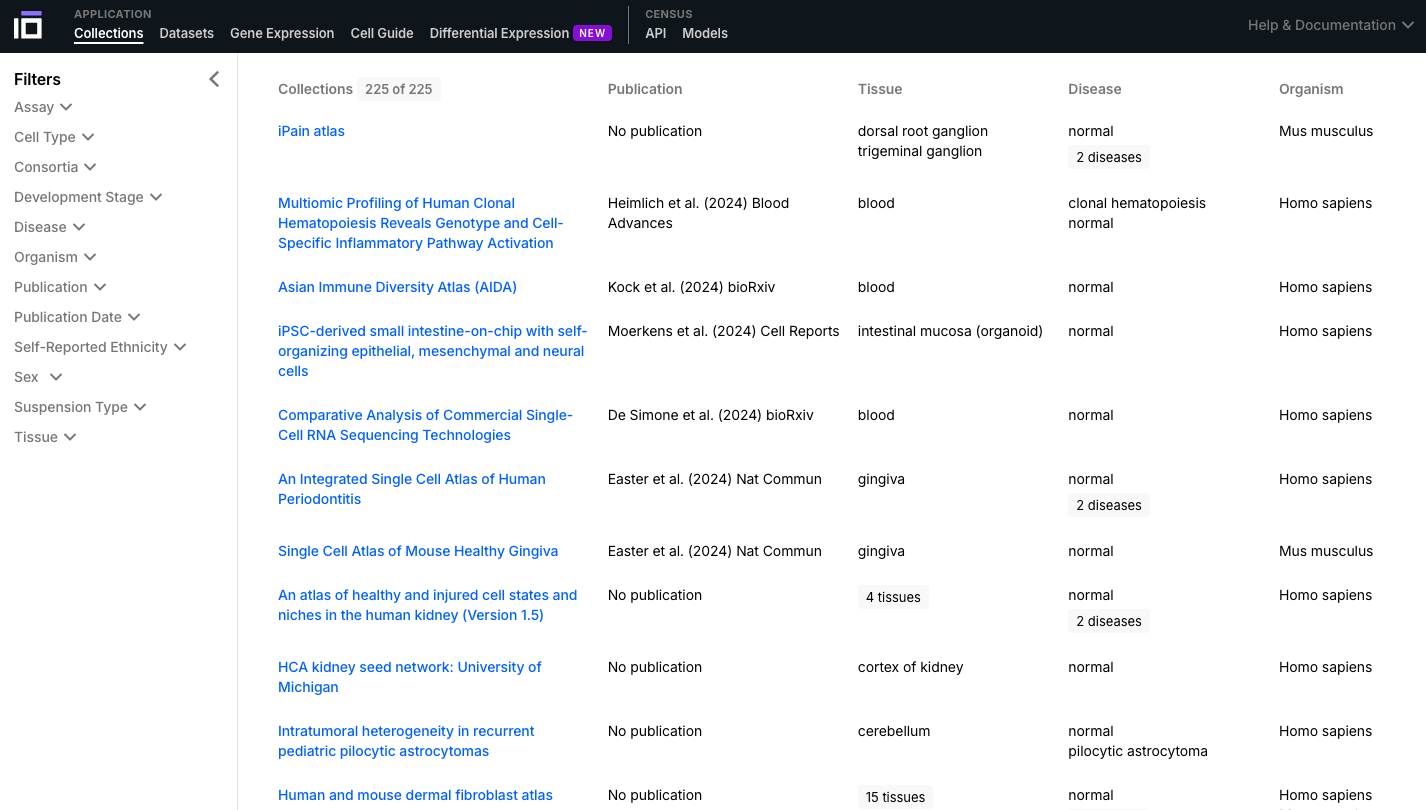
CellxGENE
Brief DescriptionCELLxGENE is a web-based portal developed by the Chan Zuckerberg Initiative (CZI) that enables interactive exploration and analysis of single-cell RNA-seq data. It provides a user-friendly interface to visualize and compare gene expression profiles across different cell types, tissues, and conditions.
Pratical Exercises:
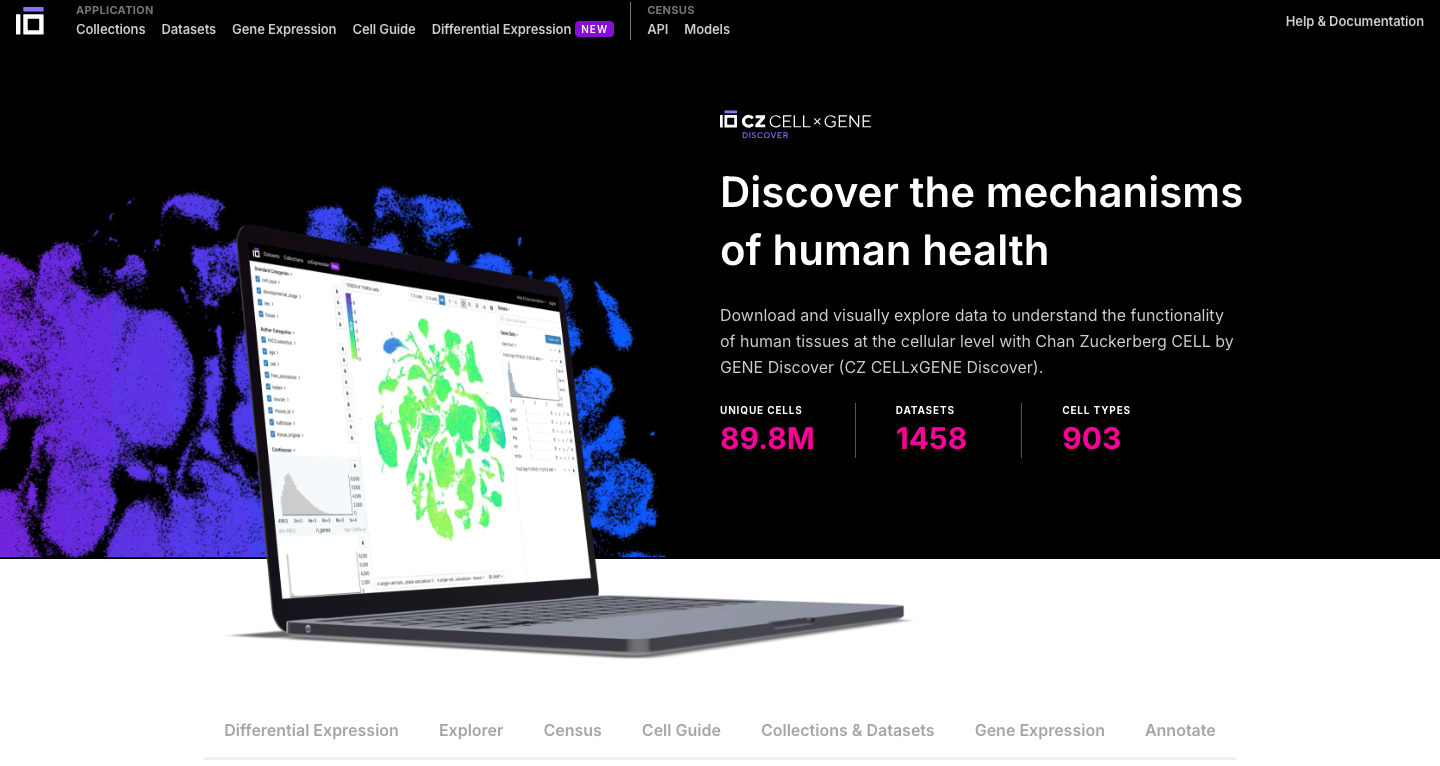
1. Explore the General Portal Interface:
- Go to the CELLxGENE website: https://cellxgene.cziscience.com/
- CELLxGENE provides a plenty of tools which allows you to further explore and analyze single-cell data.
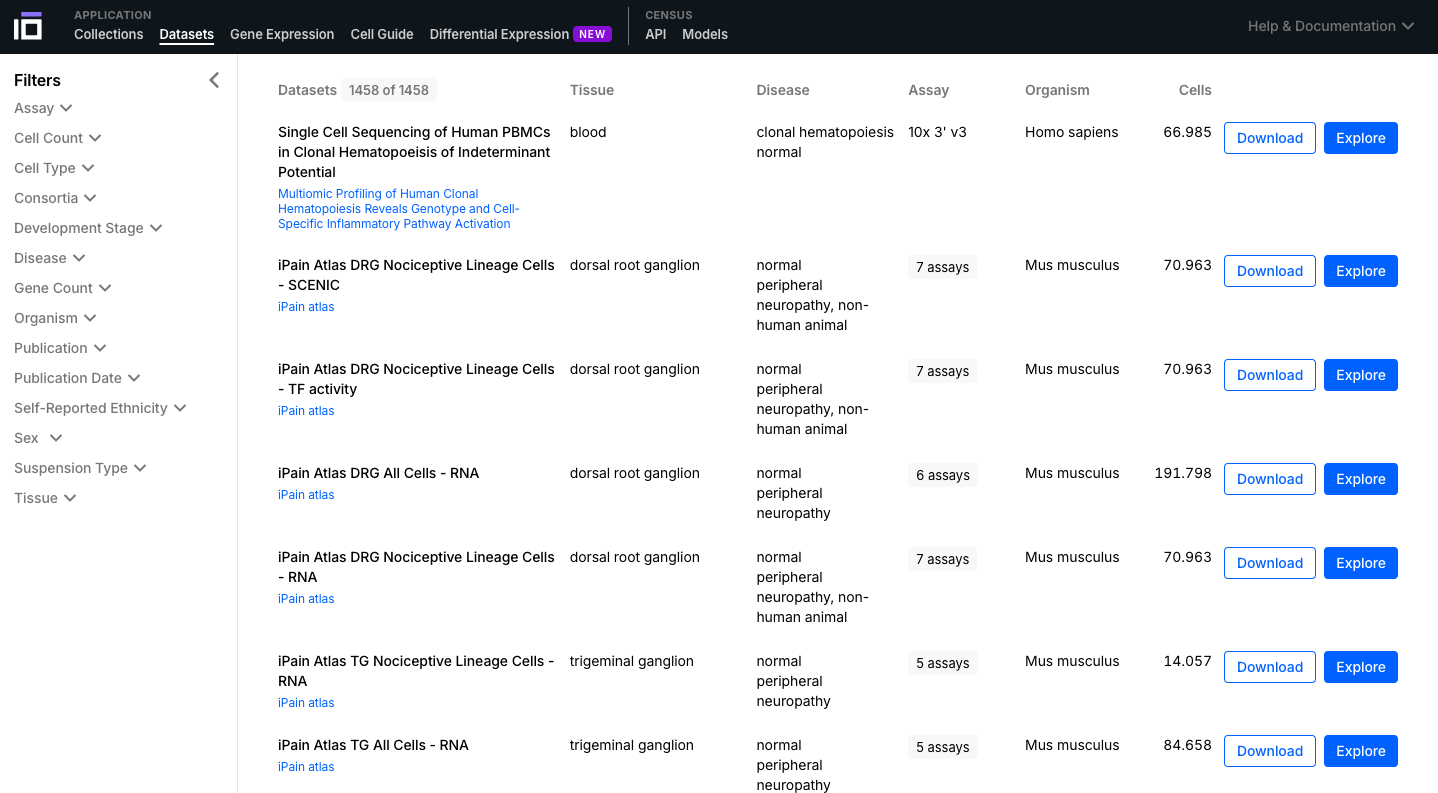
- Navigate through the Collections and Datasets available and select one of interest to further explore. You can use the "Filters" option to select the data according to different aspects of interest (e.g. cell type, disease, self-reported ethnicity, sex).
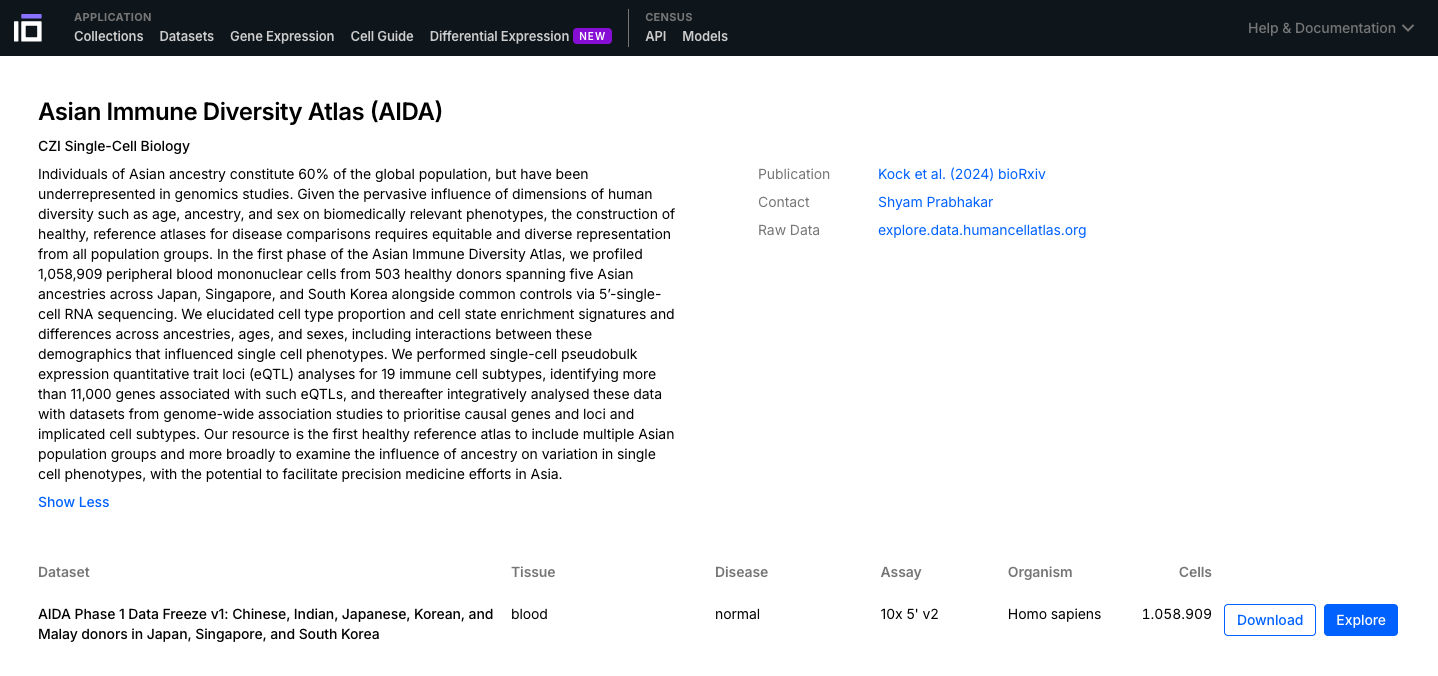
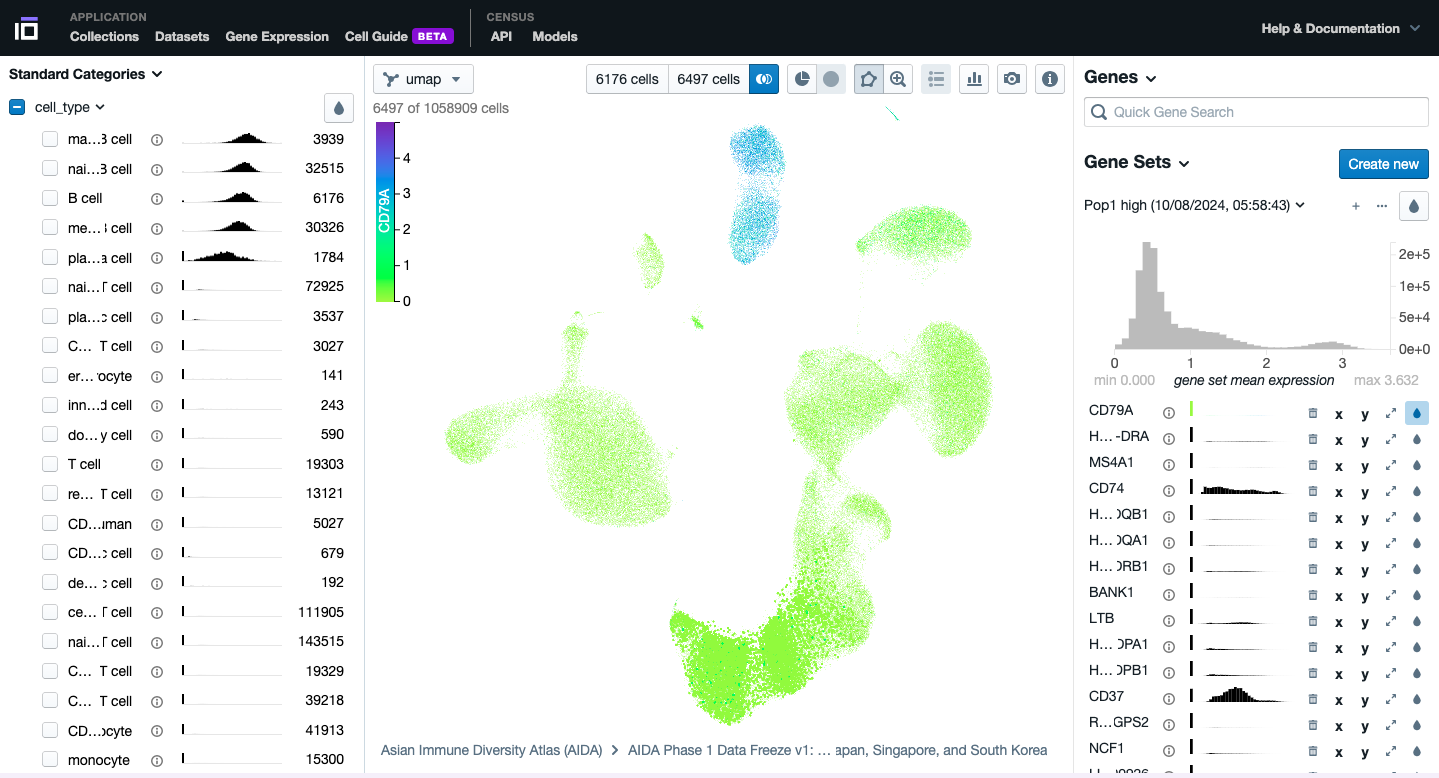
2. Explore a Dataset of Interest:
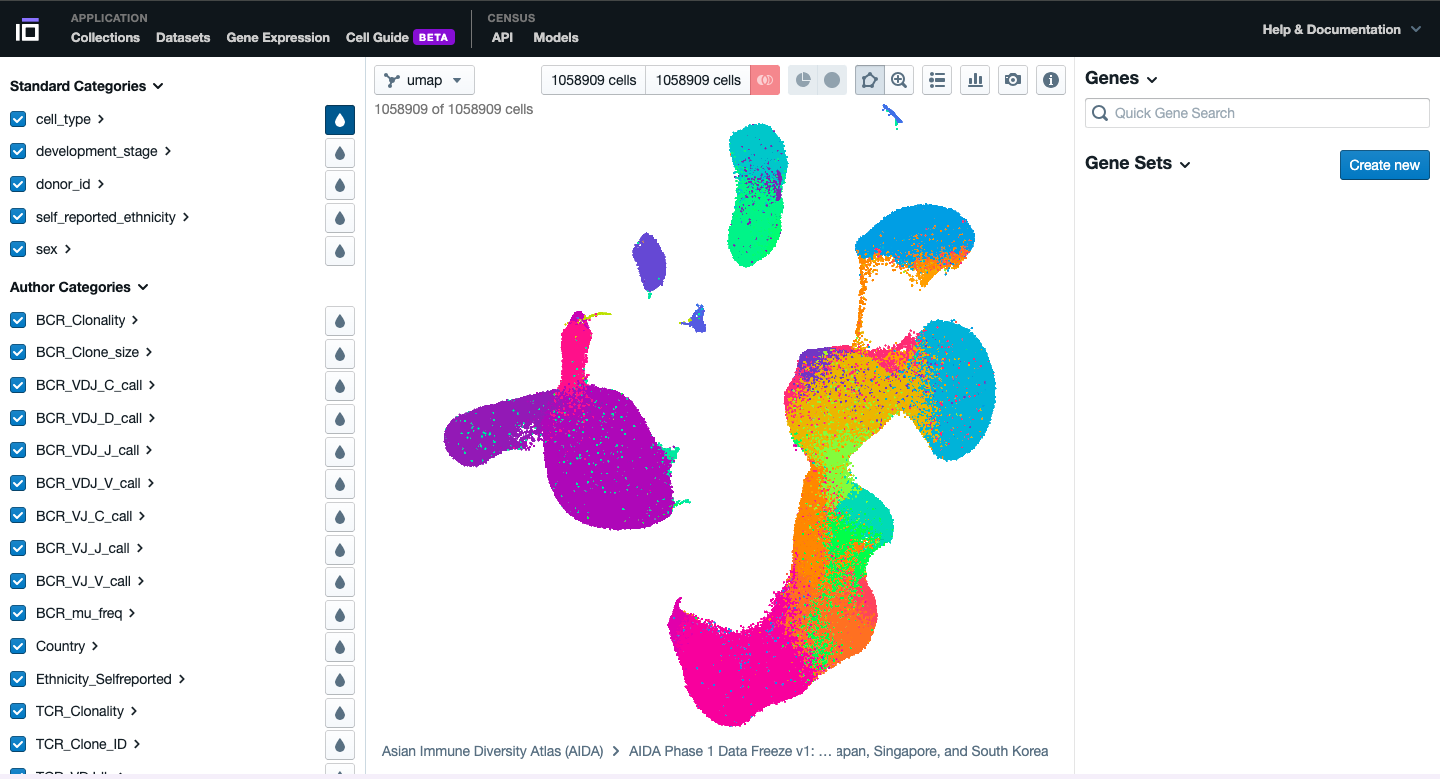
- Explore the different functionalities available. Navigate through the different categories, activating the collors for each cell available based on the cell type, developental stage, ethnicity, sex, disease (if available), etc.
- Play with the cells, try to explore the different graphics available and to obtain different visualization of the data according to your preferences.
- Select two groups of cells of your interest to identify the top differentially expressed genes. Do it based on your preferences: cell type, sex, disease status, etc. Change the colors of one of the differentially expressed genes of interest.
- Play with the different functionalities available to further explore your dataset of interest.
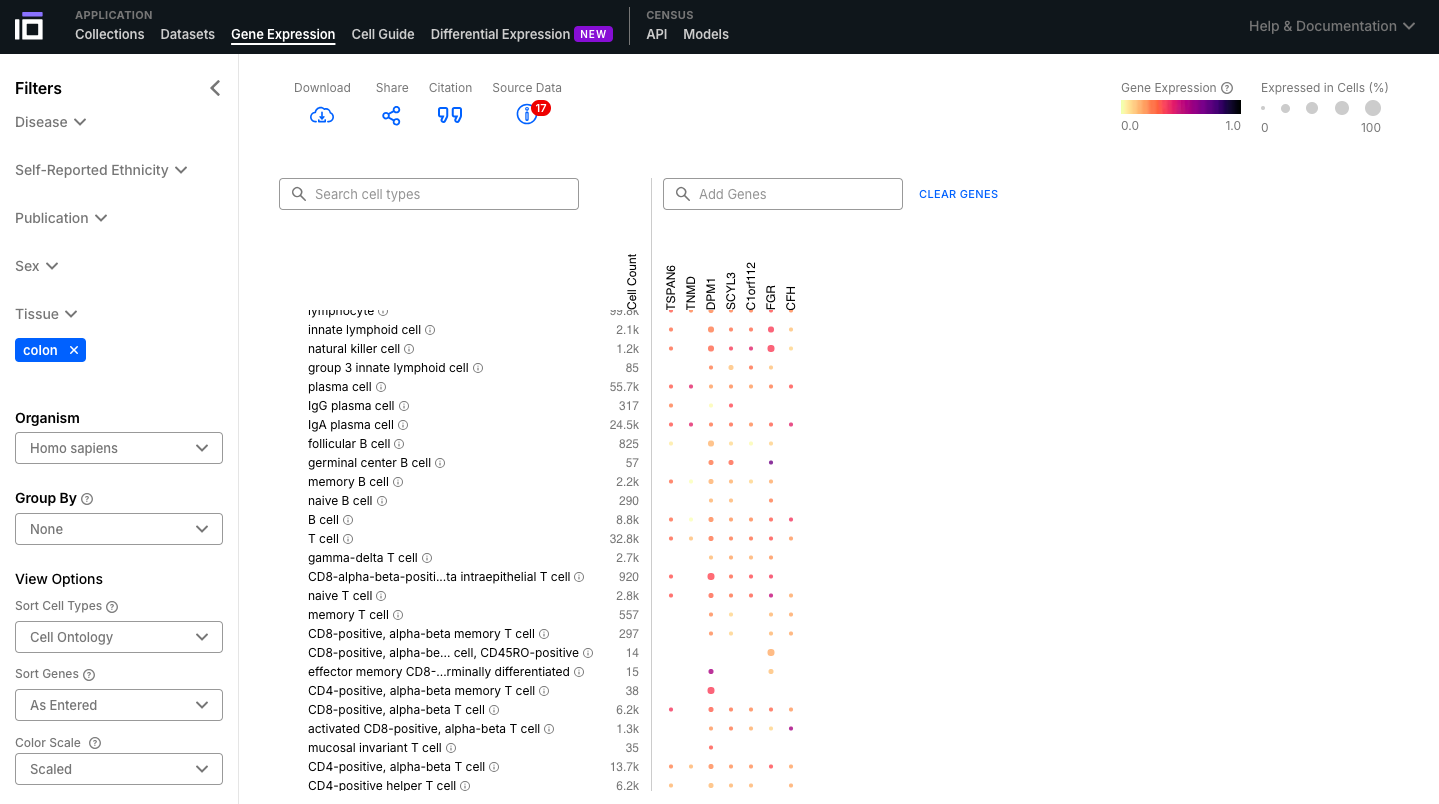
3. Explore the Gene Expression Functionality:
- Select the dataset of interest based on the Filters; add a list of interest and visualize their expression across the different cell types.
- Explore the graphic, ovserving their expression levels and porcentage of cells expressing that gene.
4. Explore the Gene Expression Functionality:
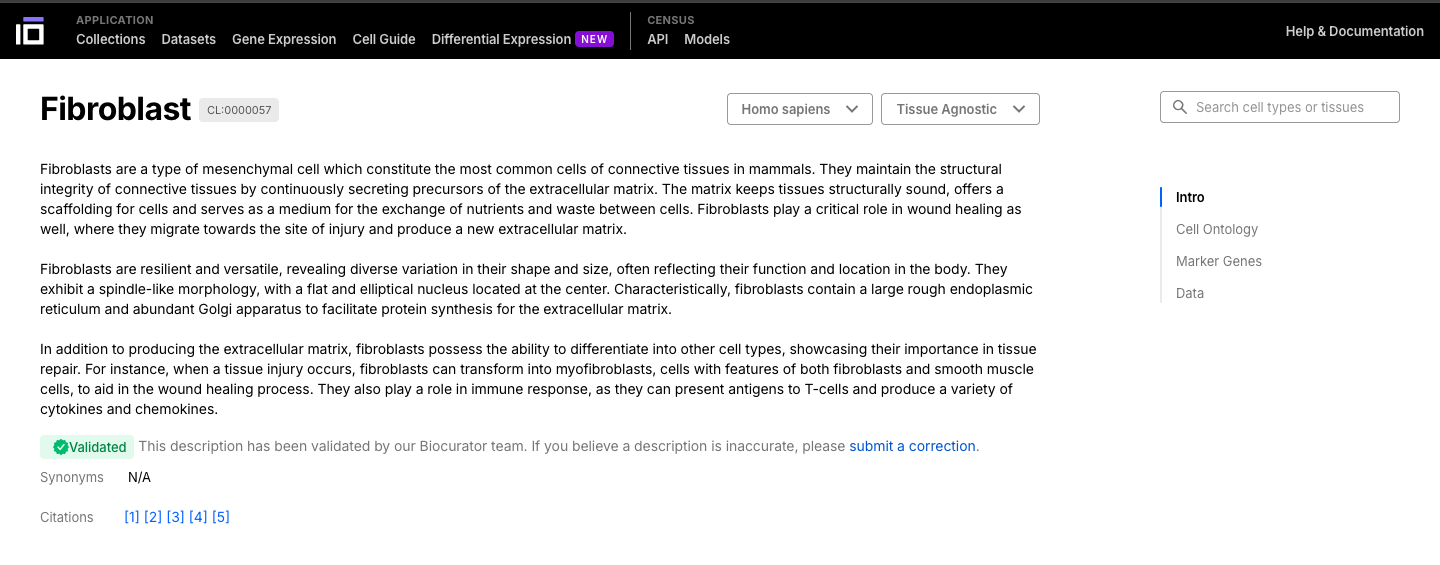
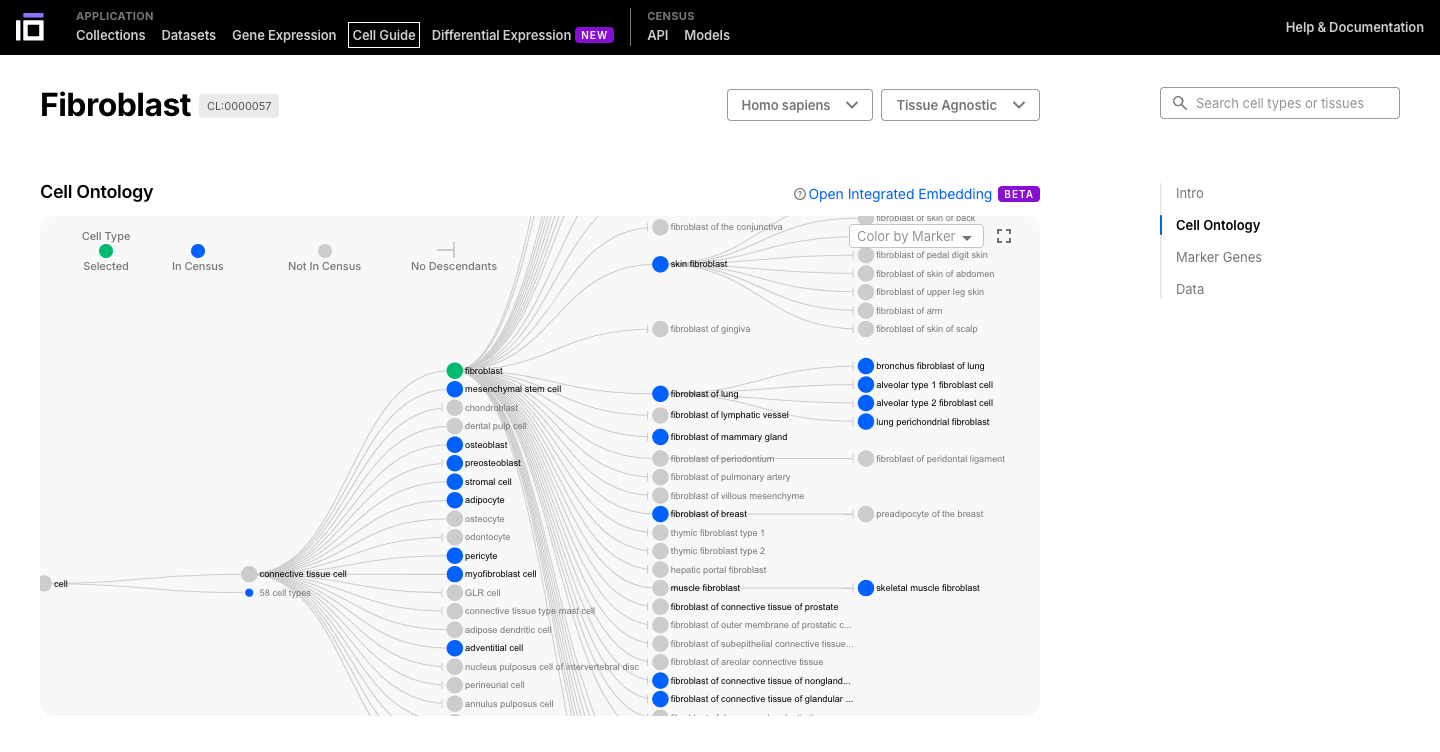
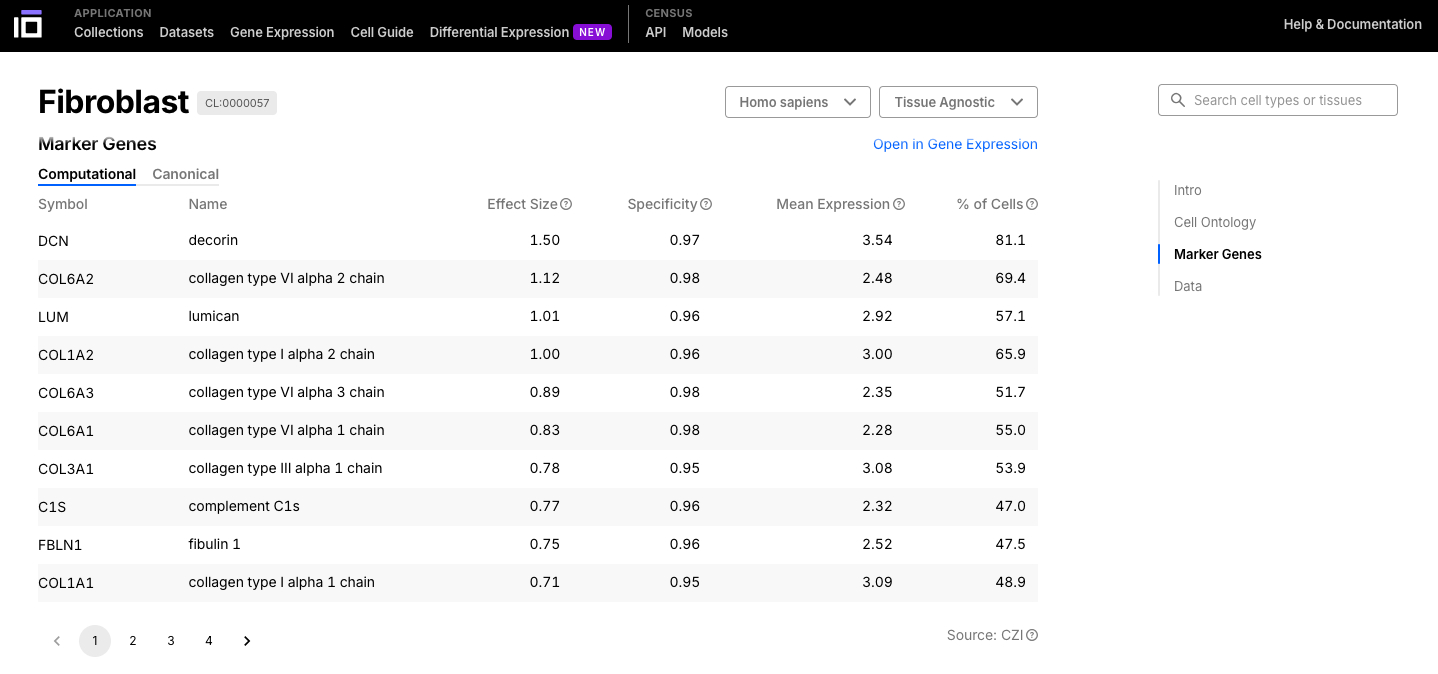
- Select a cell or a tissue of interest and navigate though its ontology.
- Cells can be have different sub-types, so they are classified based on an ontology.
- The cell ontology (CL) is a standardized framework for describing and categorizing cell types based on their characteristics, functions, and relationships. It provides a common language and set of terms to define and annotate cell types across different species, tissues, and datasets.
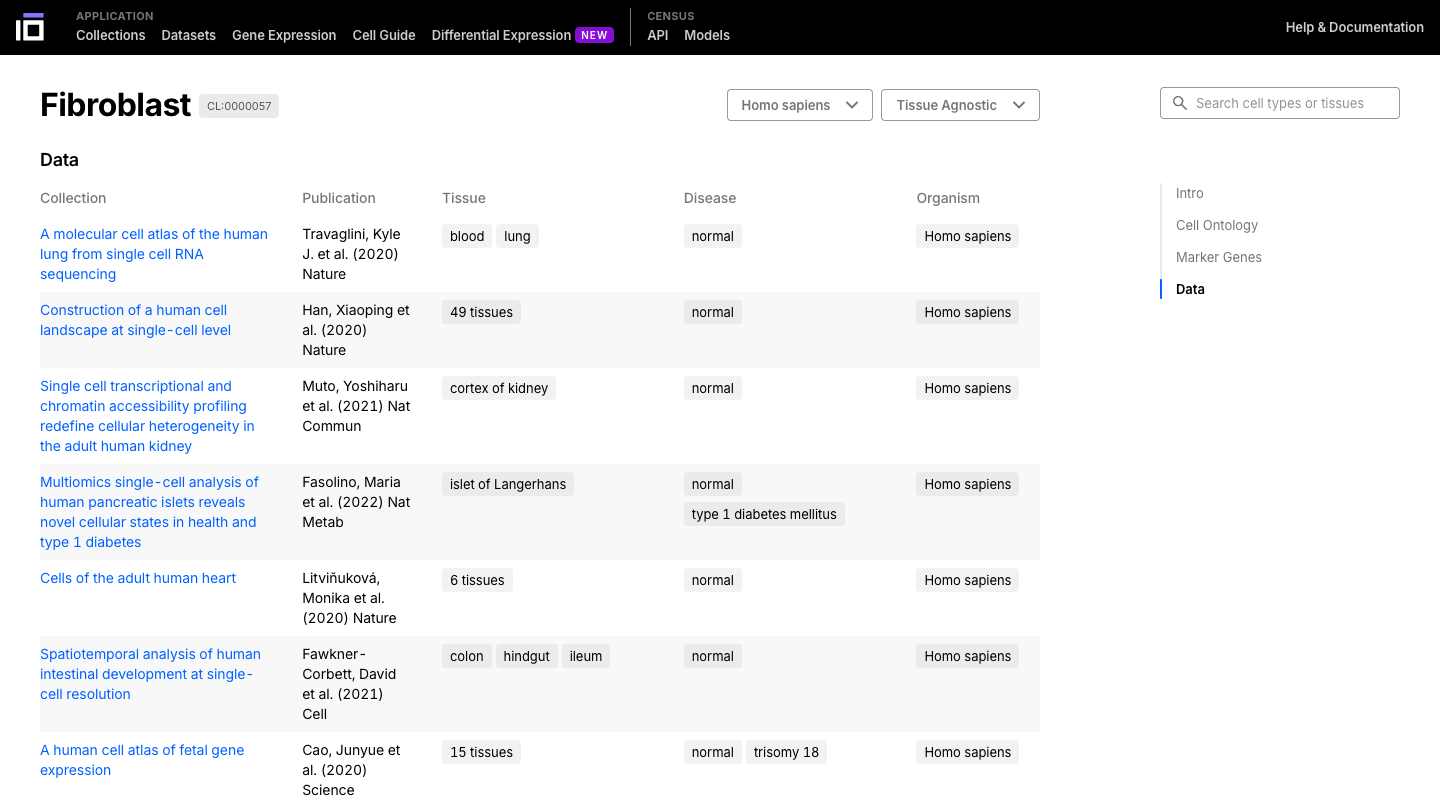
- Navigate through the cell or tissue of your interest, exploring its description, ontology, marker genes and data available.
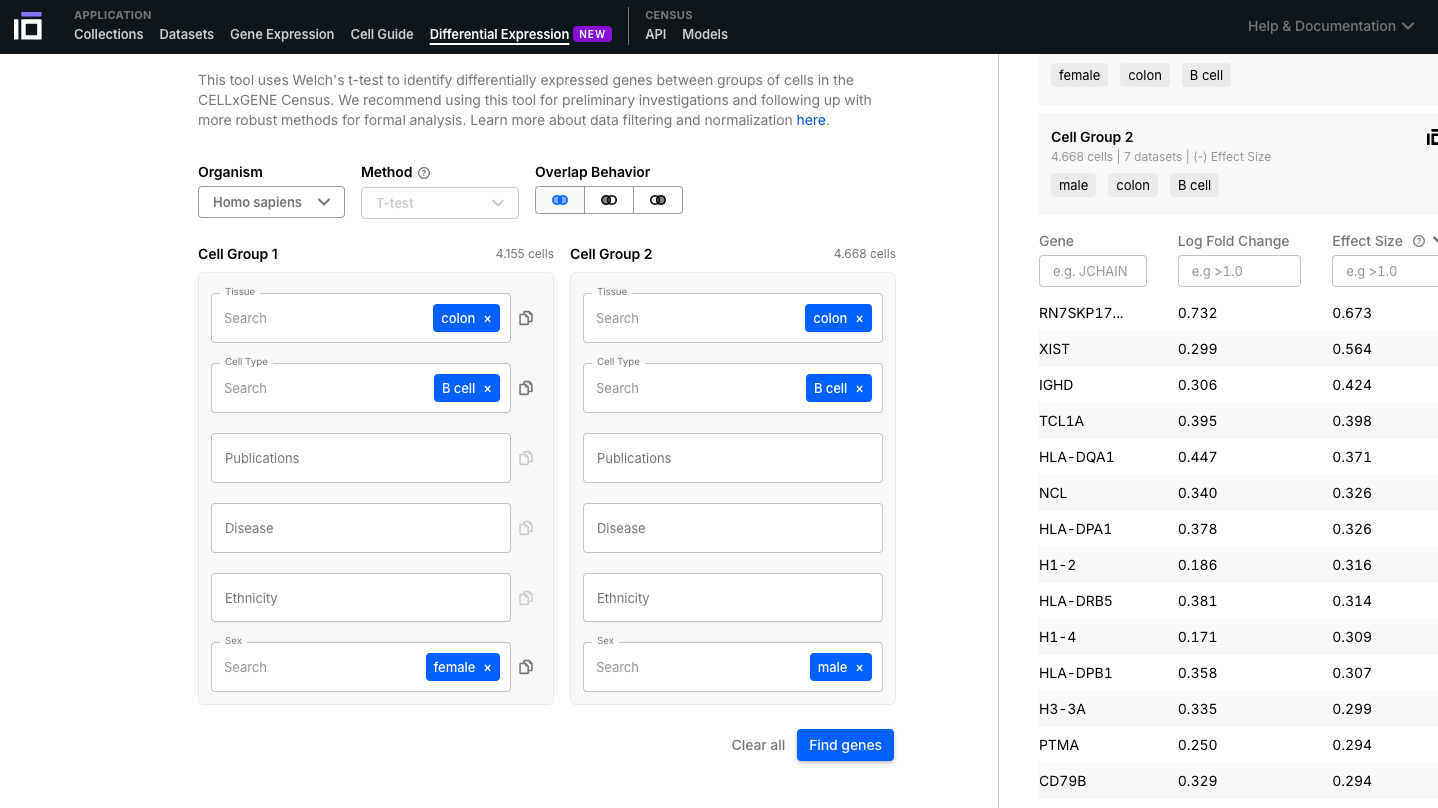
5. Explore the Gene Expression Functionality:
- Select the groups you want to perform a differential expression analysis based on the organism, tissue, cell type, disease, ethnicity, sex, among other options available.
- In this example we identified the differentially expressed genes according to the sex in B cells from the colon.
6. Explore the CELLxGENE Census:
- Get familiarized with the Census platform, which allow you to access, query, and analyze all single-cell RNA data from CELLxGENE.
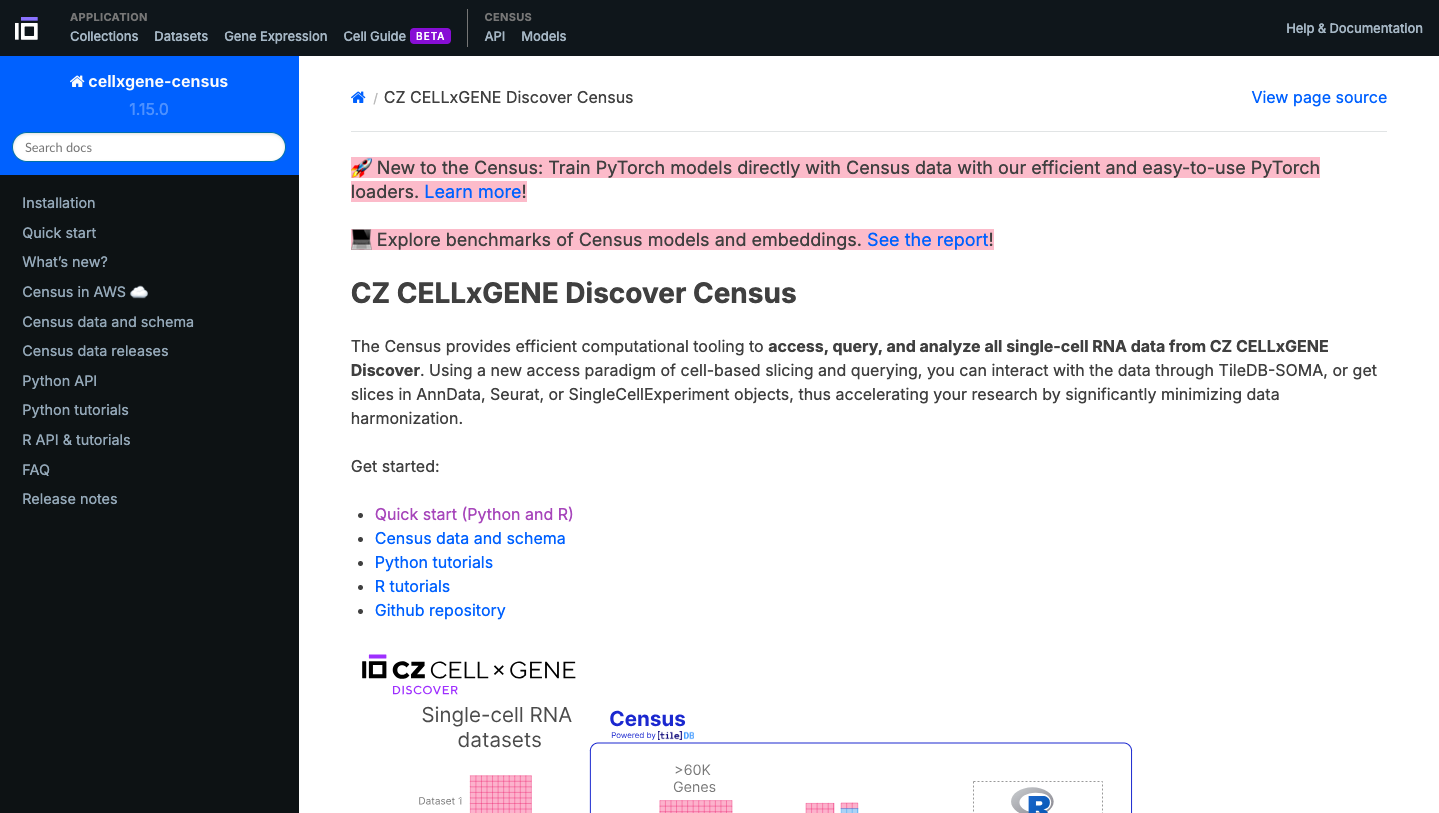
7. Explore the CELLxGENE Census:
- Now enjoy the reposity, by playing with the data and genes of interest. You can use the embedded browser available below, or the main browser from your computer: https://cellxgene.cziscience.com/
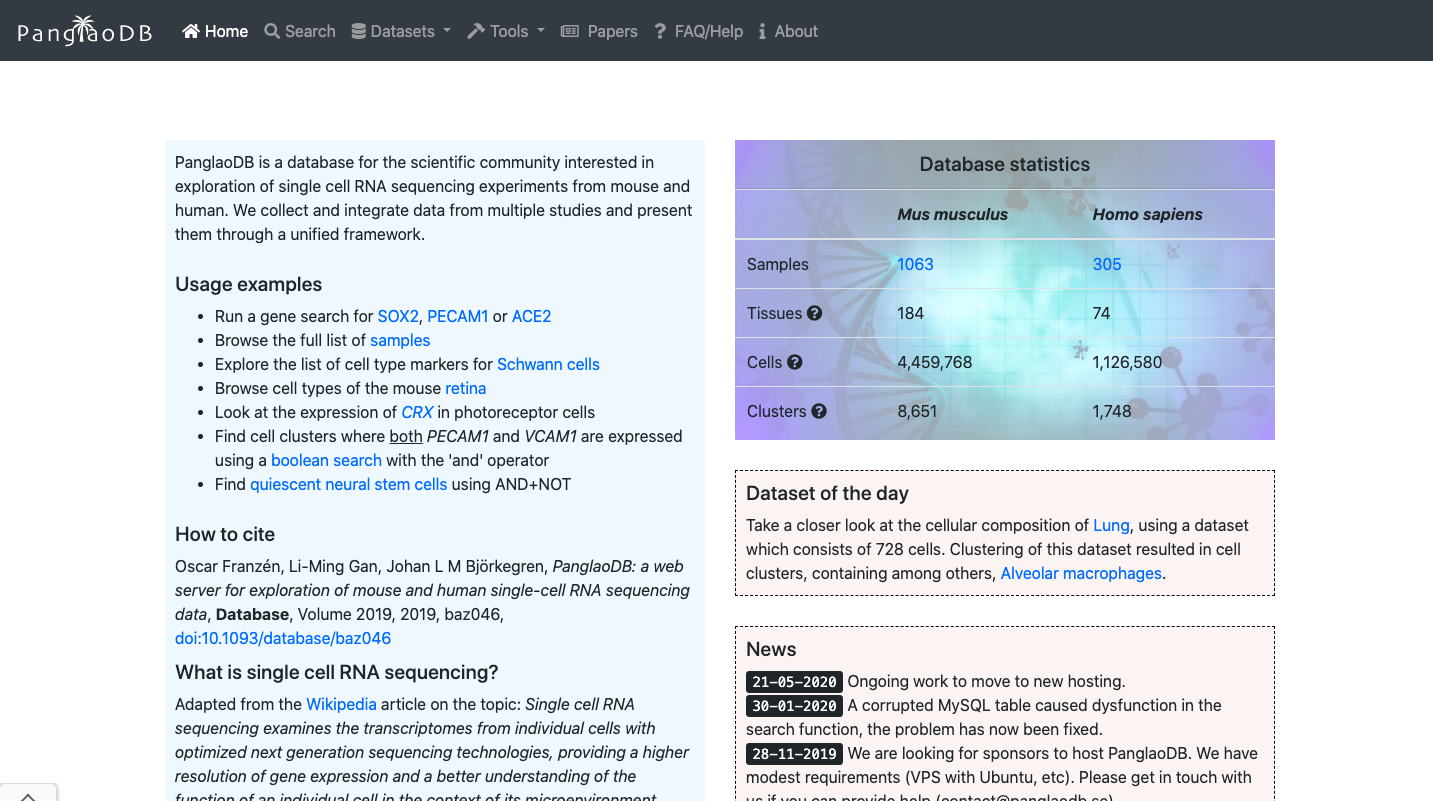
Panglao DB
Brief Description:PanglaoDB is a database for the scientific community interested in exploration of single cell RNA sequencing experiments from mouse and human. We collect and integrate data from multiple studies and present them through a unified framework. Despite being currently discontinued, it is very useful to explore marker genes.
Practical Exercises:
1. Explore the General Portal Interface:
- Go to the PanglaoDB website: https://panglaodb.se/
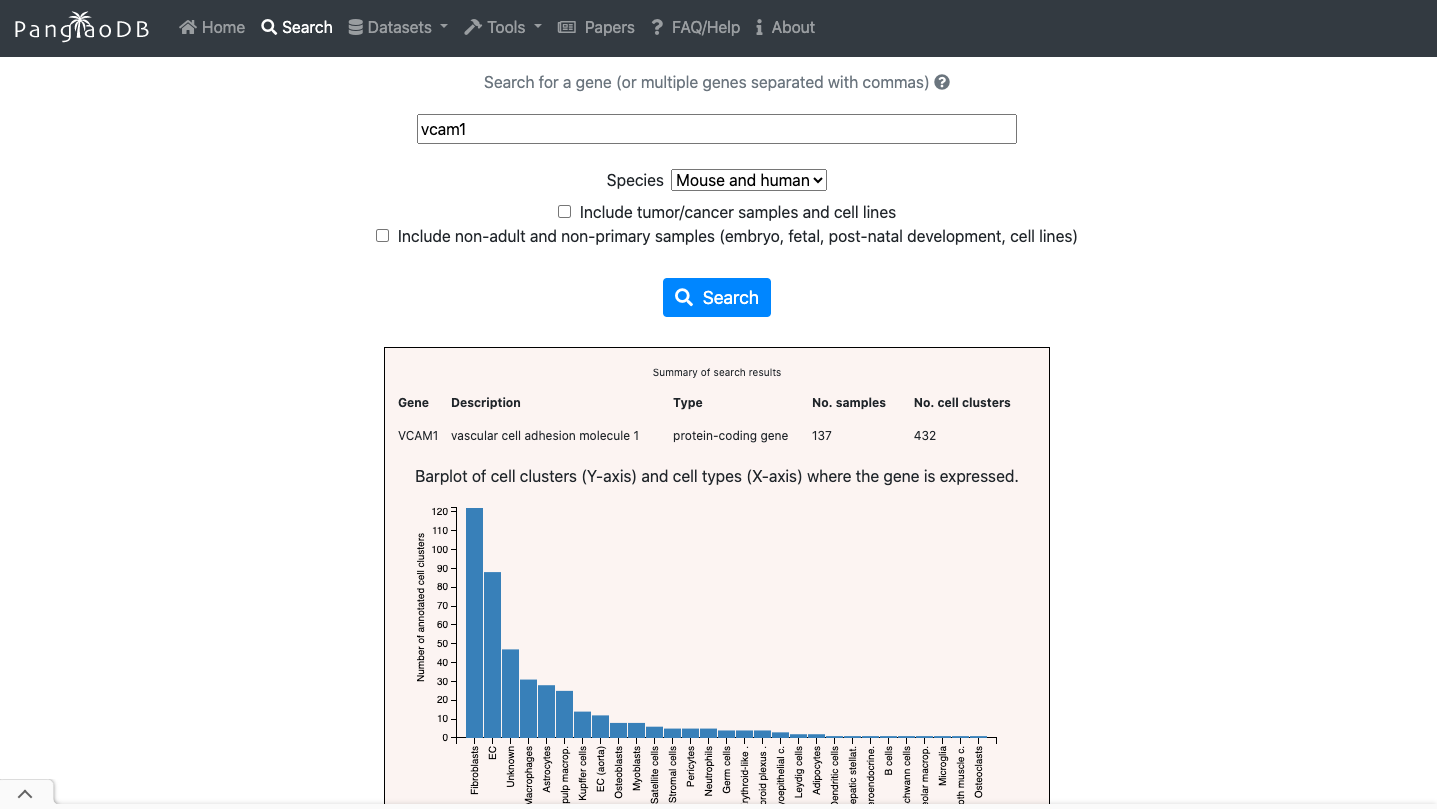
- Navigate through the Search options to explore the repository.
- You can evaluate the expression of a gene of interest across.
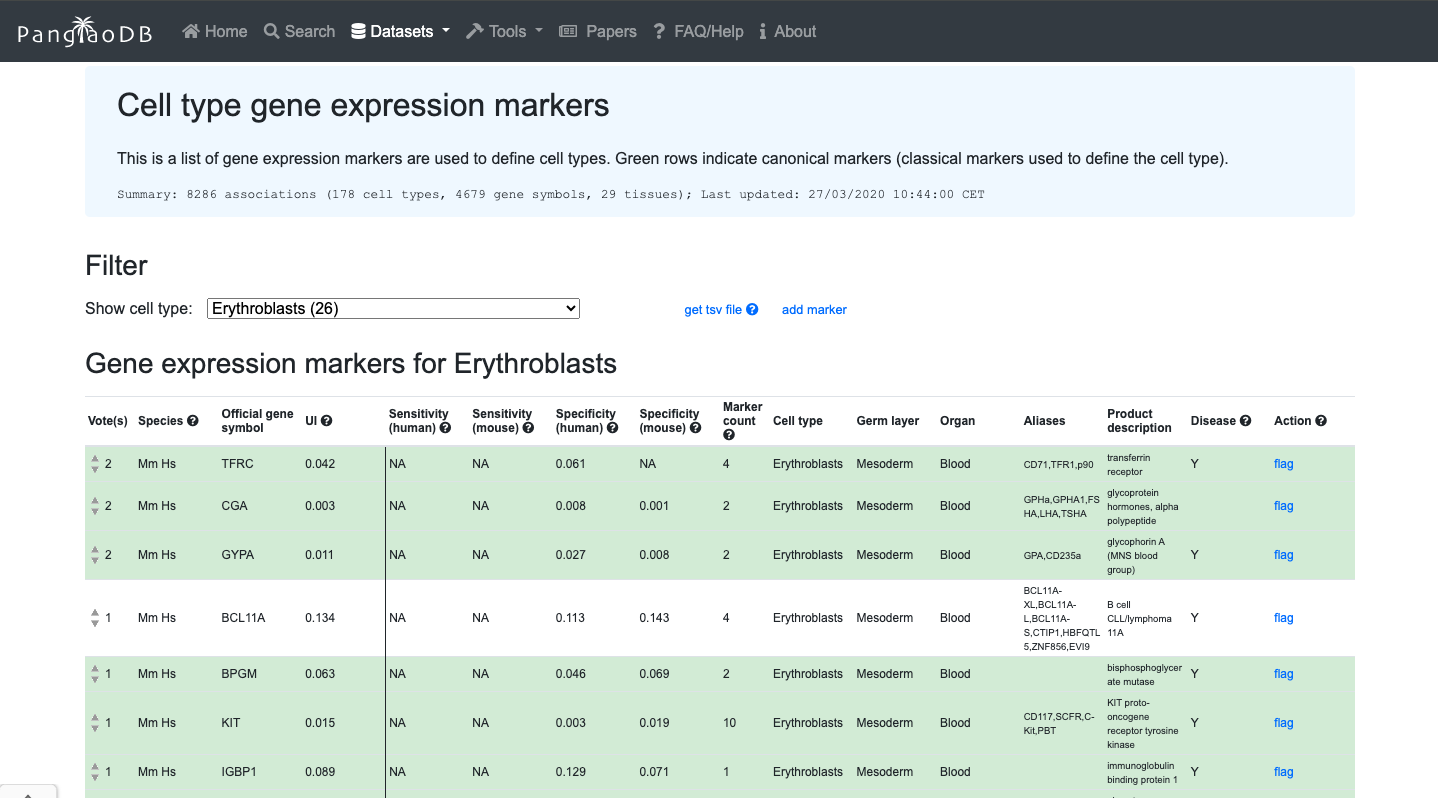
- You can also explore de cell markers of the cell type of interest.
2. Now enjoy the reposity, by playing with the data and genes of interest. You can use the embedded browser available below, or the main browser from your computer: https://panglaodb.se/
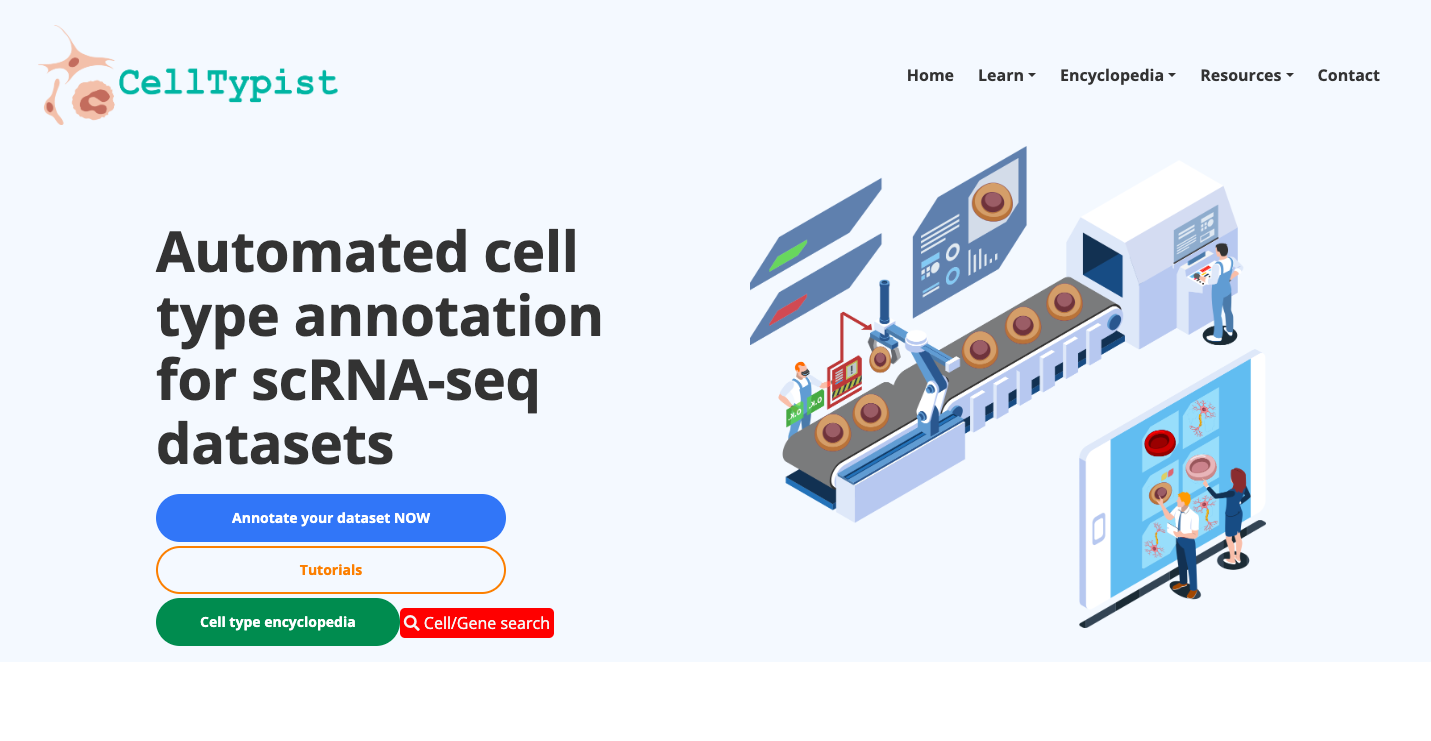
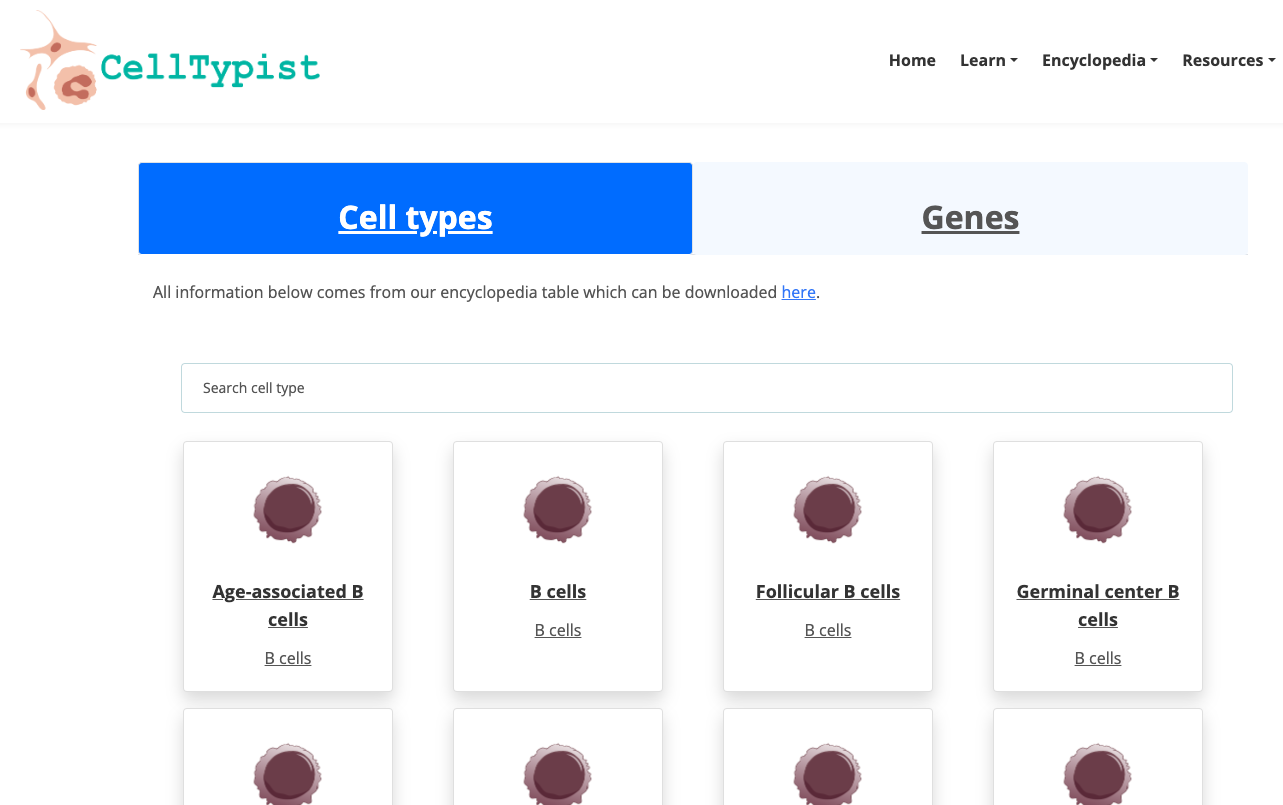
CellTypist
Brief Description:CellTypist is a web-based platform designed to facilitate cell type identification, classification, and annotation. It provides a user-friendly interface for researchers to annotate and classify cell types on their own data.
Practical Exercises:
1. Explore the General Portal Interface:
- Go to the CellTypist website: https://www.celxltypist.org/
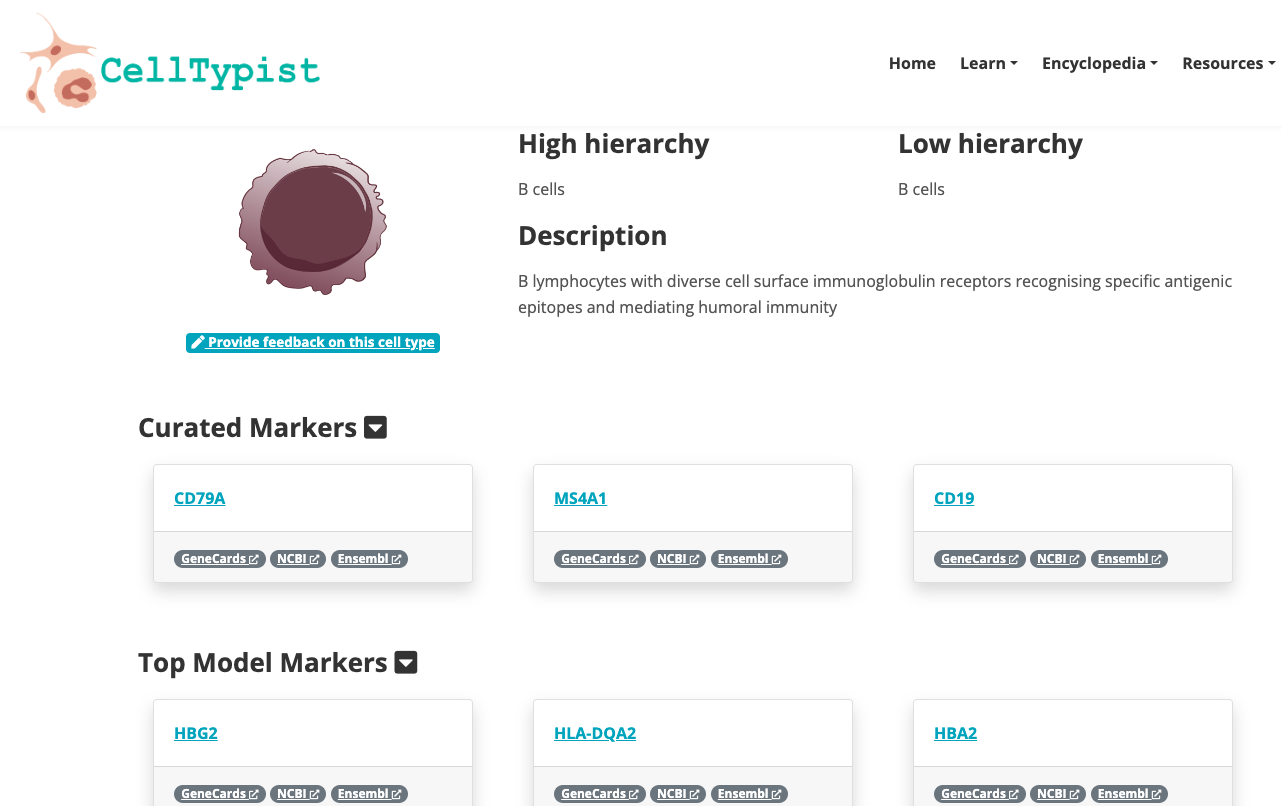
- Navigate through the available Encyclopedia. Explore deeper a group of cells of your interest.
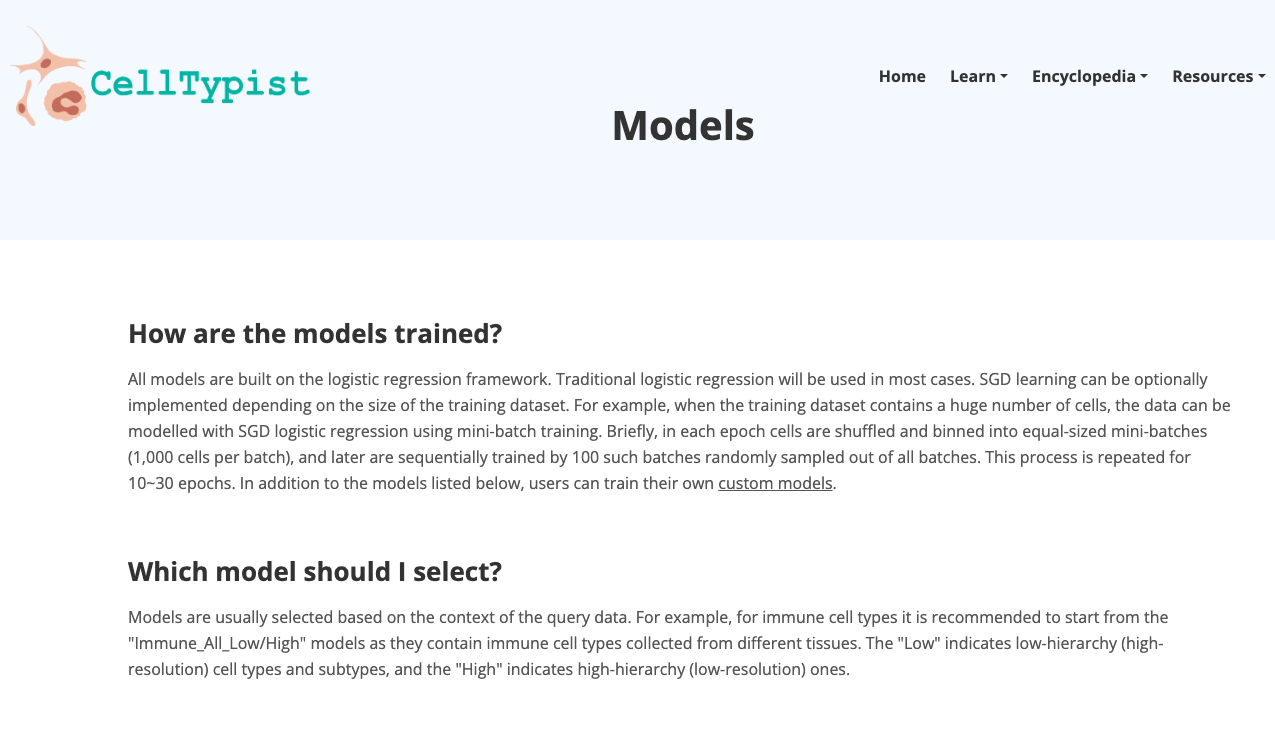
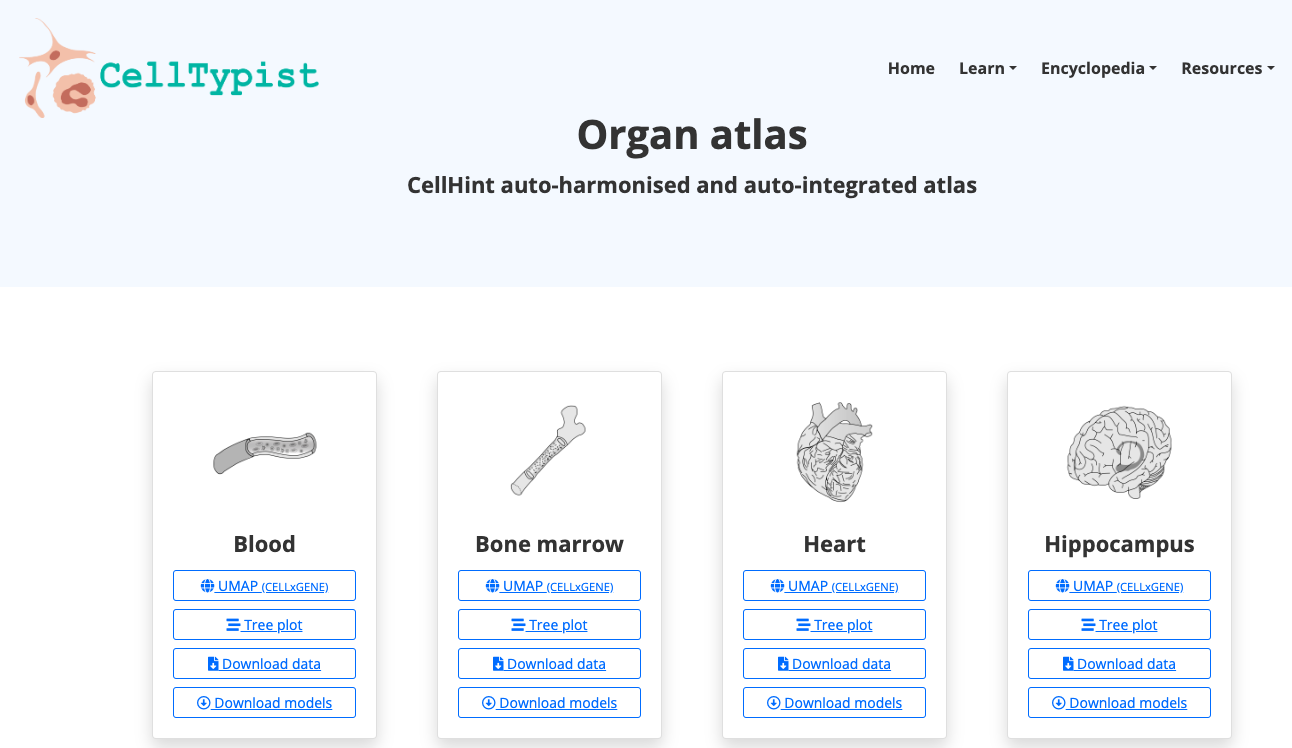
- In "Resources", navigate through the models available; explore the organs there available, as well as have access to the Pyhton package.
- At the "Home" web page, explore the automatic tool to annotate your own data.
- Access the available tutorials to dive into the platform functionalities.
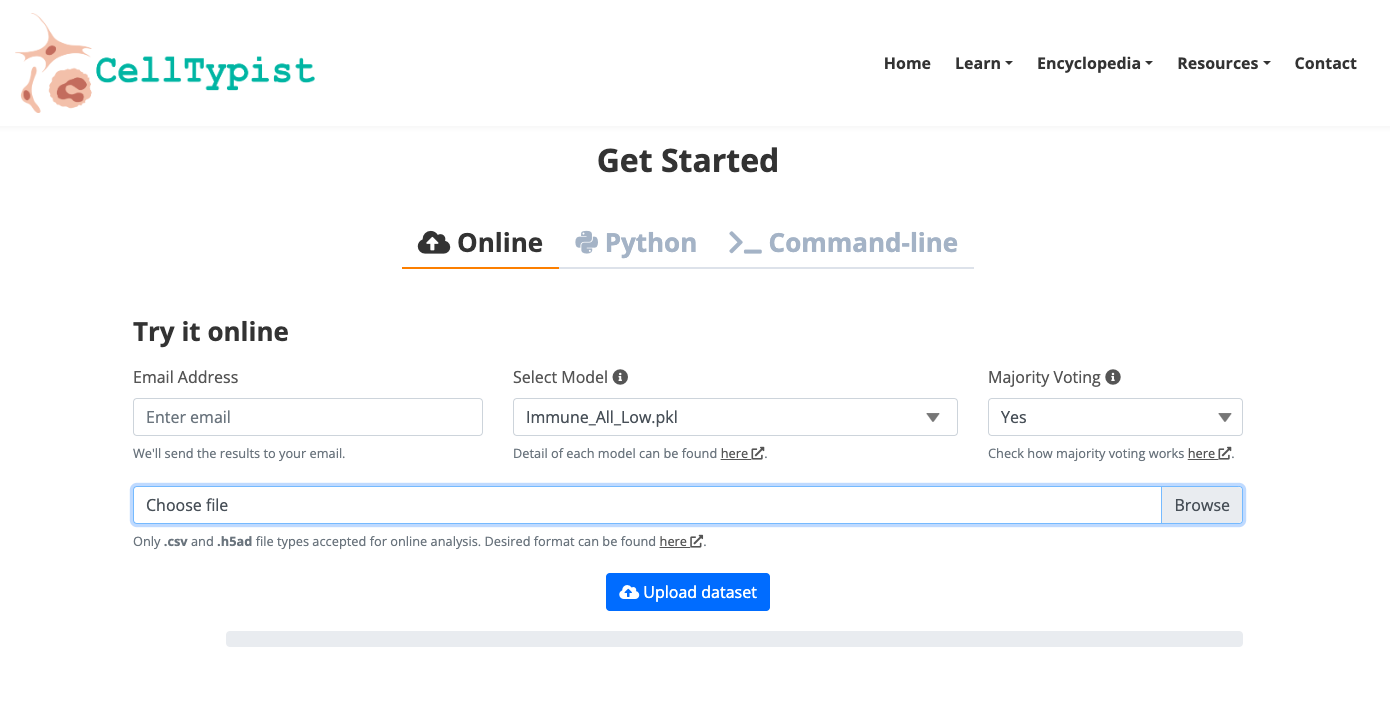
2. Now enjoy the platform, by playing with the data and genes of interest. You can use the embedded browser available below, or the main browser from your computer: https://www.celltypist.org/
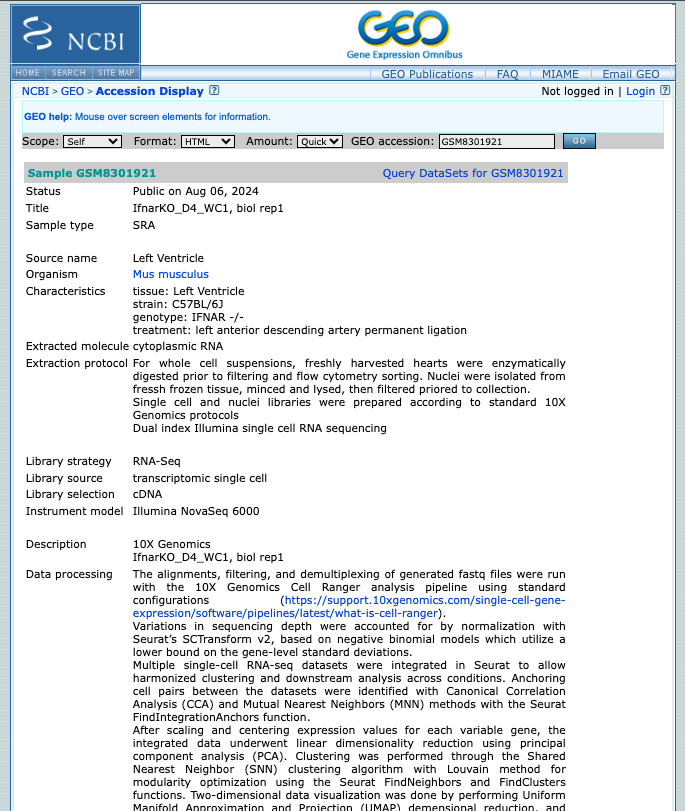
GEO (Gene Expression Omnibus)
Brief DescriptionGEO is a comprehensive public database that archives and freely distributes microarray, next-generation sequencing, and other forms of high-trhoughput functional genomic data. It is an invaluable resource for researchers, supporting discovery of new insights into gene function, regulation and expression; supporting the data reuse.
Practical Exercises:
1. Explore the General Portal Interface:
- Go to the GEO website: https://www.ncbi.nlm.nih.gov/geo/
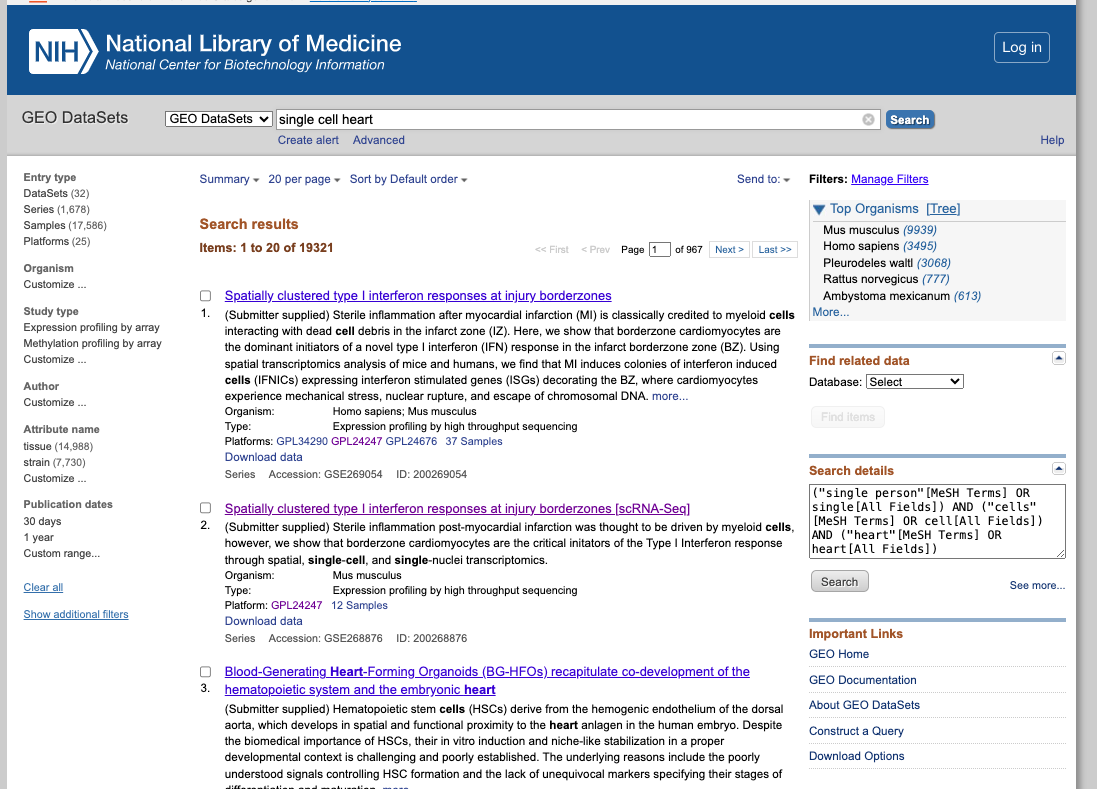
- Search for a dataset of interest, using for exampple the following keywords: "single cell heart"
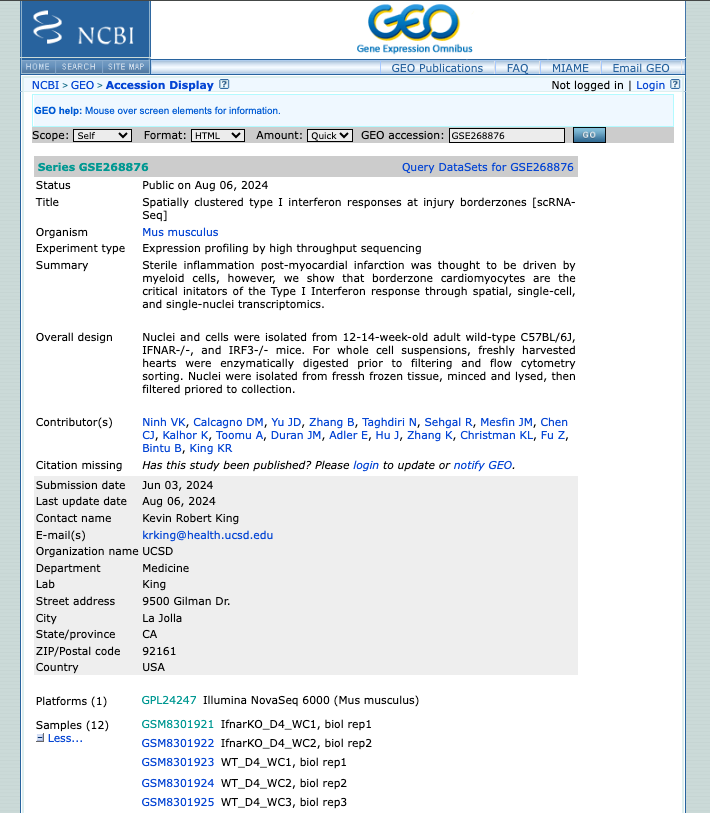
- Explore the public datasets related to heart single-cell experiments (or related to the keywords used). Select one to obtain further information from that study.
- Navigate through the samples available.
- Evaluate if they followed the FAIR principles when depositing their data.
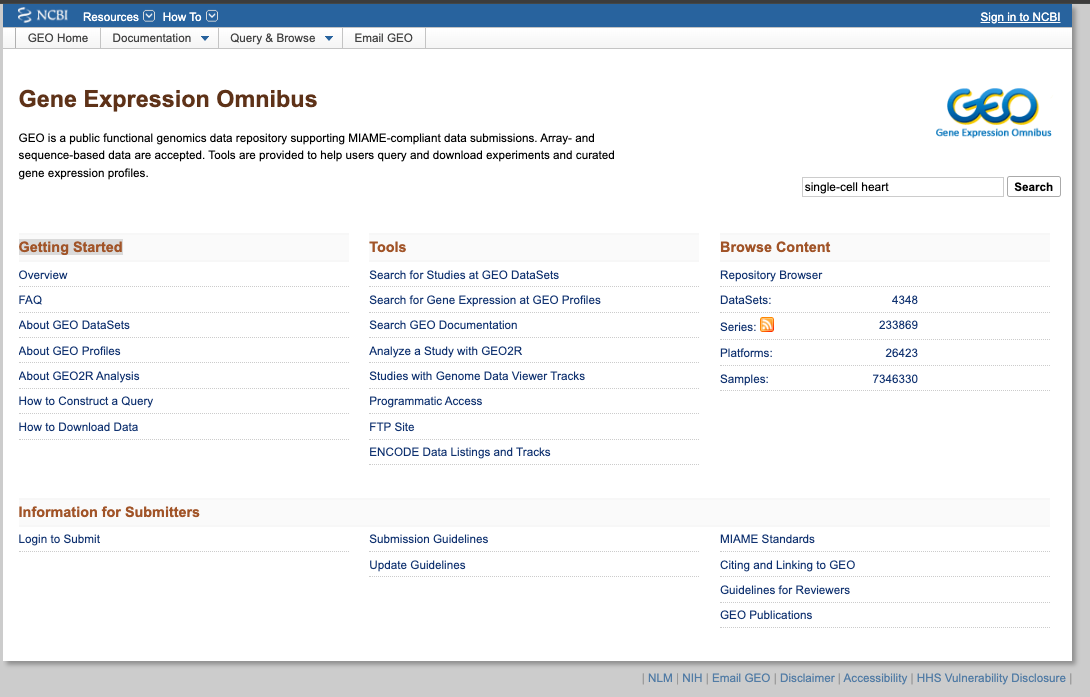
2. Now enjoy the repository, by playing with the datasets of interest. You can use the embedded browser available below, or the main browser from your computer: https://www.ncbi.nlm.nih.gov/geo/
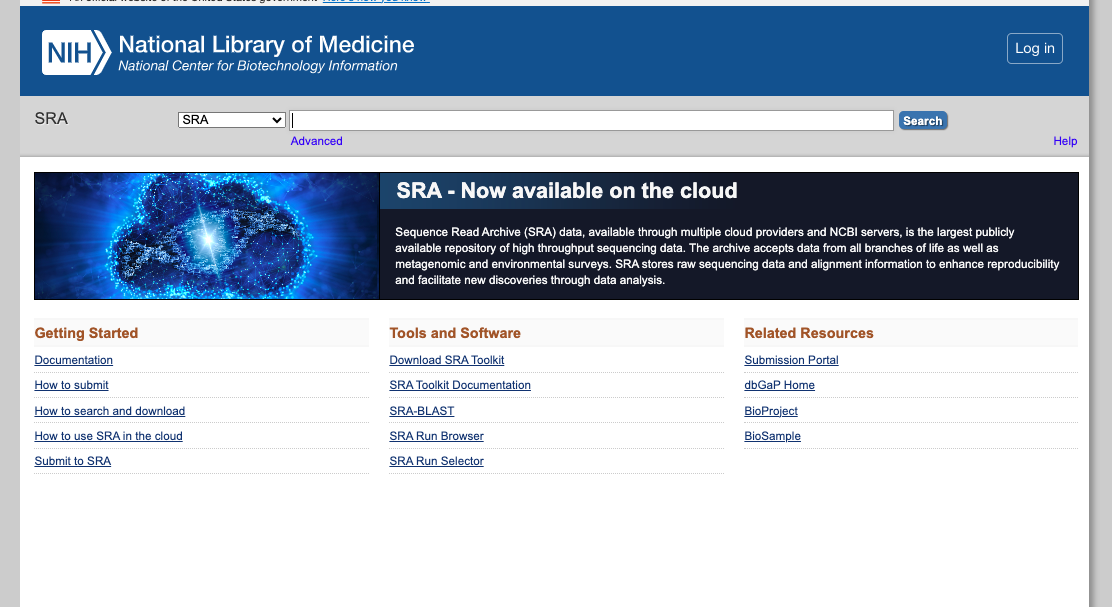
SRA (Sequence Read Archive)
Briefing Description:SRA is a comprehensive public database that archives and freely distributes high-throughput sequencing data, including RNA-seq, DNA-seq, and other forms of next-generation sequencing (NGS) data.
Practical Exercises:
1. Explore the General Portal Interface:
- Go to the SRA website: https://www.ncbi.nlm.nih.gov/sra
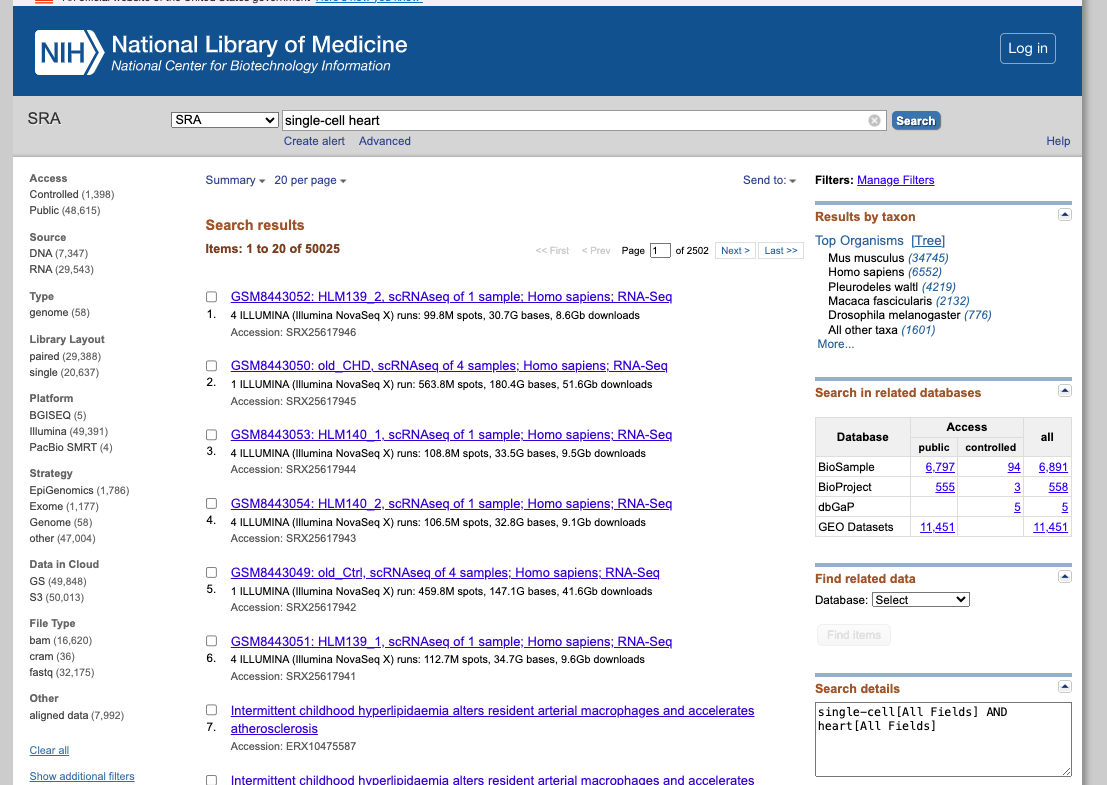
- Search for a dataset of interest, using for exampple the following keywords: "single cell heart"
- Filter the result according to the source, sequencing platform, organism of interest, or other features available.
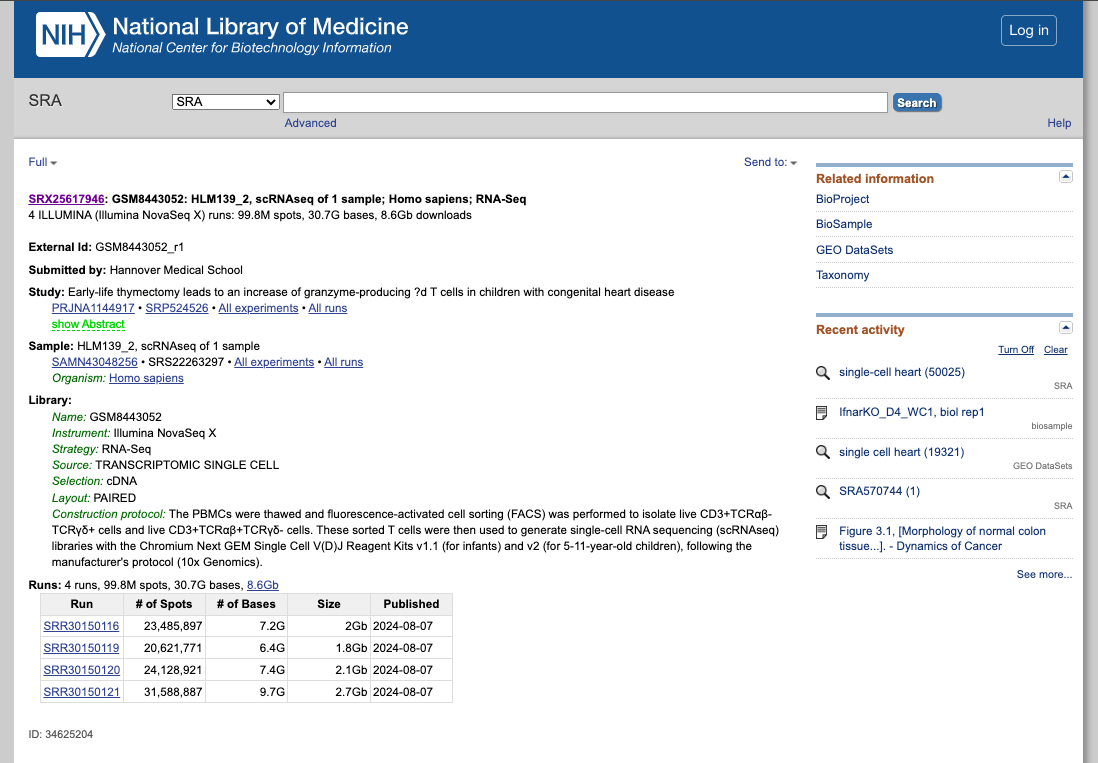
- Explore the public datasets related to heart single-cell experiments (or related to the keywords used). Select one to obtain further information from that study.
- Navigate through the samples available.
- Evaluate if they followed the FAIR principles when depositing their data.
2. Now enjoy the repository, by playing with the datasets of interest. You can use the embedded browser available below, or the main browser from your computer: https://www.ncbi.nlm.nih.gov/sra
NOTE:
In addition, there is SRA Explorer, an interactive SRA data visualization tool, which facilitates navigation and access to raw data stored in the SRA, allowing for efficient data searching and downloading.